PowerBI vs LiveDocs For Modern Data Team
Power BI dominates most data conversation, it’s mature, everyone knows something using it. But lately, there’s been question: is there a better way to actually work with data, or are we just choosing the safe option?
That’s where tools like Livedocs come in, and honestly, the comparison gets interesting fast. We’re not just talking about two different products, we’re talking about two fundamentally different philosophies about how data teams should operate in 2026.
What Are We Really Comparing?
Let’s establish what each tool is trying to accomplish.
PowerBI

It has been Microsoft’s business intelligence flagship since 2015. It transformed how companies think about dashboards by making them accessible to business users, not just IT departments. The drag-and-drop interface lets non-technical people connect to data sources, build visualizations, and share reports without writing code.
Power BI is enterprise-grade through and through. It integrates seamlessly with the Microsoft ecosystem (Azure, Teams, SharePoint, Excel). It’s got a massive user base, extensive training resources, and a feature set that’s been refined through thousands of enterprise deployments.
Livedocs
Livedocs takes a different approach entirely. Instead of focusing on no-code drag-and-drop, it embraces code, but makes it accessible through AI. You’re working in a collaborative notebook environment where Python and SQL live side-by-side, and an AI assistant handles the heavy lifting.
Think of it this way: Power BI assumes most users don’t want to code. Livedocs assumes AI can handle the coding for them, which is subtly but importantly different. One restricts what you can do to keep things simple. The other gives you full power but makes it easier to use.
The Initial Setup
Getting Started With PowerBI
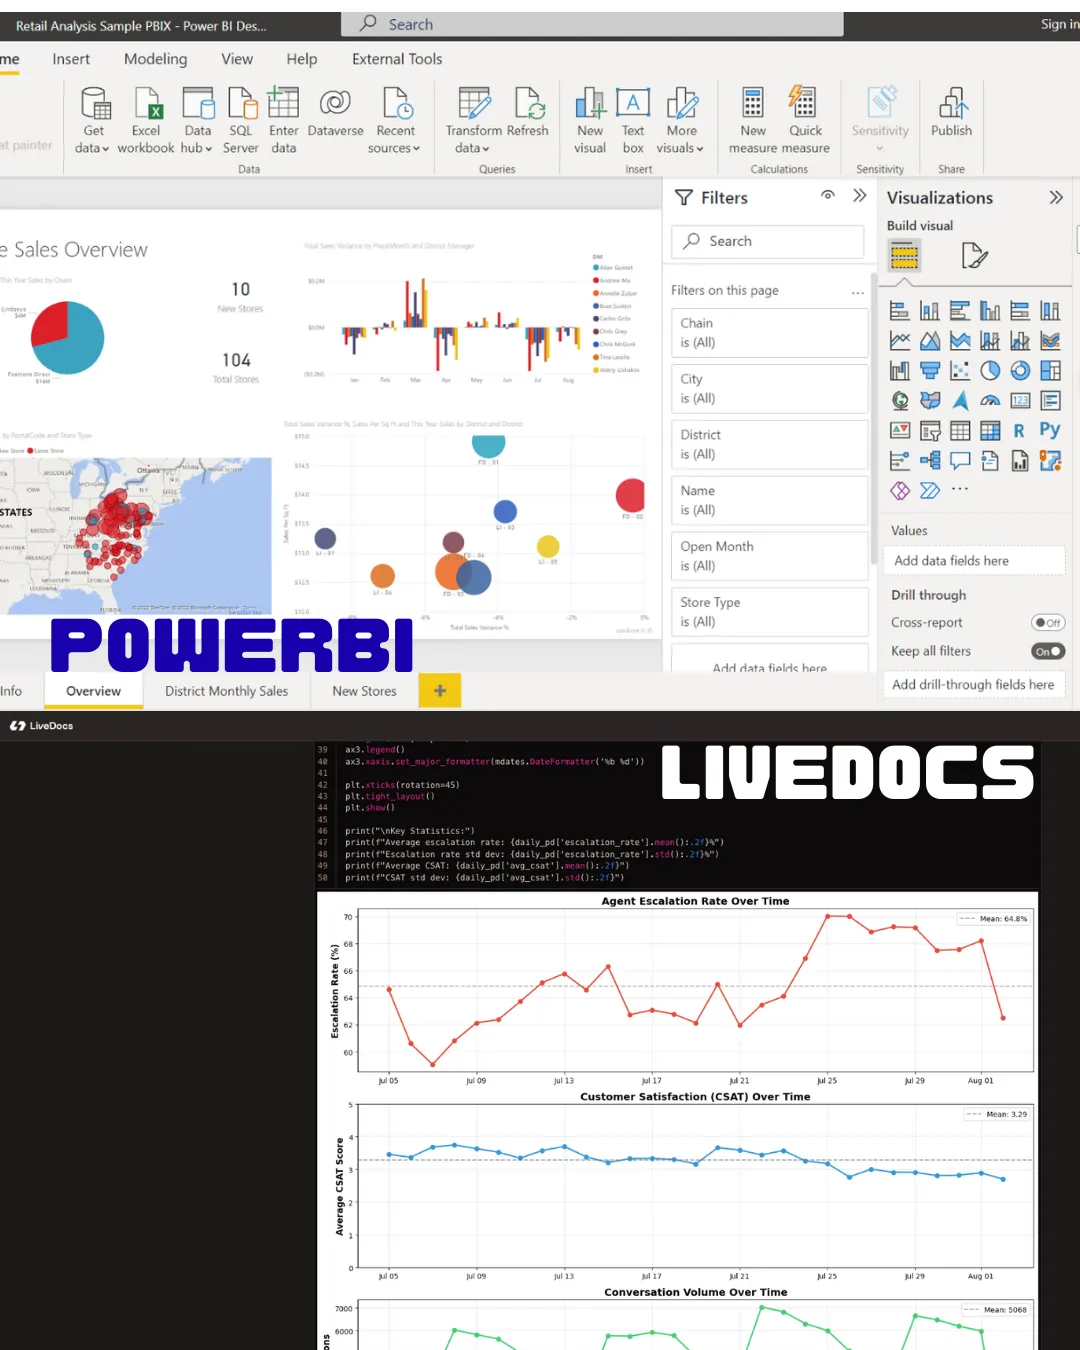
Power BI Desktop is free to download from Microsoft. Installation is straightforward, download, install, launch. You’re greeted with a clean interface offering options to connect data sources: databases, Excel files, cloud services, web sources.
Connecting to data is relatively simple for standard sources. Excel files? Drag and drop. SQL databases? Enter credentials. Cloud services like Google Analytics or Salesforce? Authenticate through their APIs. Power BI’s connector library is extensive, hundreds of data sources supported.
🚨 But here’s where complexity creeps in. You’re working in Power BI Desktop, which is software on your machine. To share dashboards with others, you need a Power BI Pro or Premium license and must publish to the Power BI Service (the cloud version). This isn’t immediately obvious to beginners.
🚨 Then there’s the learning curve for the interface itself. Dimensions versus measures. Relationships between tables. DAX (Data Analysis Expressions) for calculated fields. These concepts aren’t difficult once understood, but they require investment.
For teams, the collaboration model involves workspaces in the Power BI Service. You publish reports there, invite members, set permissions. It works, but it’s not real-time collaboration, it’s more like version control with manual updates.
Getting Started with Livedocs
Livedocs is cloud-native from the start. Sign up online, no download needed. You’re immediately in a workspace that feels familiar if you’ve used Google Docs or Notion.
Connecting data happens once per workspace. Connect PostgreSQL, Snowflake, BigQuery, or upload files (CSV, Excel, Parquet). Everyone on your team instantly has access. No individual setup, no credential sharing, no “works on my machine” issues.
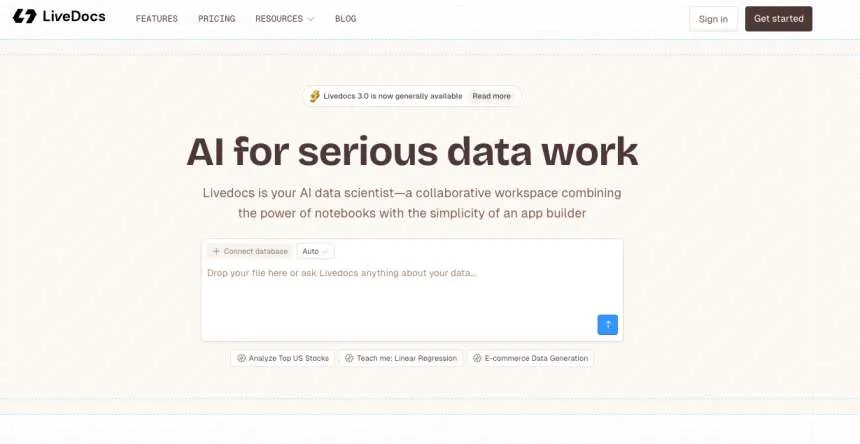
The interface is intentionally minimal, a document editor with cells where you can write SQL, Python, or just ask questions in plain English. The AI prompt box is front and center. Type a question, get an answer with code and visualizations automatically generated.
For teams, collaboration is Google Docs style. Multiple people in the same notebook simultaneously, seeing each other’s cursors, commenting on cells. Changes are instant. There’s no publish step, everything’s already shared.
The free tier is genuinely usable: unlimited notebooks, 16GB memory, 2 vCPU, up to 3 team members. You can actually get work done without paying.
LiveDocs’ AI prompt box is front and center. Type a question, get an answer with code and visualizations automatically generated.
The Day-to-Day Workflow
A Day in Power BI
You’re building a sales dashboard. Data comes from your SQL database, supplemented by an Excel file with budget targets. Here’s the typical workflow:
Open Power BI Desktop. Connect to SQL Server, enter credentials, select tables. Import the Excel file separately. Now you need to create relationships between these tables, matching customer IDs or date fields. Power BI’s relationship view helps, but you need to understand data modeling basics.
Build your first visual: drag “Region” to the axis, “Sales” to values. A bar chart appears. Change it to a line chart using the visualization pane. Add filters for date ranges.
Create a calculated measure using DAX to show percentage change: Sales Growth = DIVIDE([Current Sales] - [Previous Sales], [Previous Sales]).
Format the visual, colors, fonts, labels, tooltips.
Add more visuals to the canvas. Arrange them into a coherent dashboard layout. Add slicers so users can filter by product category or time period.
When satisfied, publish to the Power BI Service. Choose a workspace, click publish. Now set up scheduled refresh so the data updates daily. Configure row-level security if different users should see different data. Share the dashboard with stakeholders. They access it through the Power BI Service in their browser or mobile app. They can interact with filters and drill down, but can’t modify the underlying structure without edit permissions.
It’s a structured process. You’re building a finished product, a dashboard meant to be consumed. The work happens in Desktop, the sharing happens in Service. There’s a clear distinction between development and deployment.
A Day in Livedocs
Same scenario: sales dashboard with multiple data sources.
You’ve already connected your SQL database to the workspace. Upload the Excel budget file, it’s now available to everyone. Open a new document.
Start with a question:
- “Show me total sales by region for Q4.” The AI writes SQL, queries your database, generates a visualization. Twenty seconds.
- “Compare that to budget targets from the Excel file.” AI joins the data sources, creates a comparison chart with variance calculations.
- “Break it down by product category.” Chart updates with new dimension.
- “Format as a stacked bar chart with percentage labels.” Visual adjusts.
You’re having a conversation with your data. Each prompt builds on context. The AI remembers what you’re working on. You’re not thinking about table relationships or DAX formulas, you’re thinking about business questions.
A teammate jumps into the same document. They add a new section analyzing customer segments. You both work simultaneously without conflicts. Someone leaves a comment on your sales chart: “Can we add previous year comparison?” You address it immediately in the same document.
When ready to share, there’s nothing to publish, stakeholders you’ve invited to the workspace can already see it. For external sharing, generate a link with view-only permissions.
The philosophy is different: instead of building a finished dashboard for consumption, you’re collaboratively exploring data and documenting insights. The artifact is the notebook itself, which can be both analysis and presentation.
Livedocs’ Real-Time Approach
Livedocs assumes collaboration is the default, not a feature you enable later.
Google Docs-style editing.
Multiple people in the same notebook simultaneously. You see each other’s cursors, changes appear instantly, no conflicts to resolve. One person writes SQL, another adds Python analysis, a third creates visualizations, all in the same document, same time.
Commenting on cells.
Questions or feedback go directly on specific parts of the analysis. “Why did you filter out these records?” “Can we try a different date range?” Conversations happen in context.
Shared data connections.
Connect a database once, everyone accesses it. No credential sharing, no individual setup. Same with uploaded files, one person uploads, everyone uses it.
Role-based access still exists (Admin, Editor, Viewer).
But the default is collaborative editing. Viewers can see everything, editors can modify, admins manage the workspace.
AI as a team equalizer.
Non-technical team members can contribute meaningfully by prompting the AI. “Show average customer lifetime value by acquisition channel.” The AI generates code, runs analysis, presents results. Technical teammates can review and refine the code if needed.
This model shines for startups, agencies, cross-functional teams, and data teams that iterate rapidly. Everyone’s in the same space, moving quickly, building on each other’s work.
The AI Factor: Different Implementations
Both tools now incorporate AI, but in meaningfully different ways.
Power BI Copilot
Microsoft has been aggressively adding Copilot features to Power BI throughout 2025. Here’s what that looks like:
Standalone Copilot (now default-on).
This lets you ask questions about reports without opening them. “What were sales last quarter?” Copilot looks at the report and model, generates answers with visuals. It first examines the report itself before querying the model, leading to better context-aware responses.
Natural language Q&A
This has improved substantially. Ask “show me top products by revenue” and Copilot generates appropriate visuals. It uses user-created hierarchies and display folder names from semantic models, making answers more relevant.
DAX query generation
This has gotten smarter. Copilot can write DAX using your model’s specific structure, including hierarchies. It helps with calculated measures and complex formulas.
Report summaries in Teams and Outlook.
Preview a Power BI item and get a Copilot-generated summary explaining what the report shows.
These are useful features, genuinely helpful. But they’re additions to the core Power BI experience. You’re still primarily working with drag-and-drop interface, building visuals manually, then occasionally asking Copilot for help or explanations.
Livedocs AI-First Approach
Livedocs puts AI at the center of the workflow, not the periphery.
Prompt-driven analysis.
Type questions in natural language, get code + visualizations. “Calculate customer churn rate by cohort.” AI writes Python, executes it, shows results. You’re not asking AI to help you work, AI is doing the work.
Context-aware data understanding.
Tag data sources using @ mentions. The AI knows your schema, table relationships, column types. When you ask “highest value customers,” it knows which tables to query and how to join them.
Model selection.
Switch between AI models (OpenAI, Anthropic, others) directly from the prompt. Different models for different tasks, some better at SQL, others at complex Python.
Code generation and execution.
AI doesn’t just suggest, it generates complete, runnable code in SQL or Python, executes it, and presents results. You can review and modify the code if needed, or just accept the output.
Iterative refinement.
Each prompt builds on previous context. The conversation is stateful. “Now add a trend line.” “Filter for last 6 months.” “Show that as a heatmap instead.” AI understands you’re refining the same analysis.
Power BI Copilot assists you in using Power BI. Livedocs AI replaces much of what you’d manually do, leaving you to focus on asking good questions and interpreting results.
Which is better? Depends entirely on what you value. If you want to learn Power BI’s data modeling and DAX capabilities, Copilot helps without taking over. If you want to analyze data quickly without learning those specifics, Livedocs AI does the work for you.
Real Use Cases: Where Each Tool Excels
Let’s get concrete about when you’d choose one over the other.
Power BI Makes Sense When:
You’re deeply embedded in Microsoft’s ecosystem.
Your company uses Azure for data storage, Teams for communication, SharePoint for documents. Power BI integrates seamlessly. Data from Azure Synapse or Azure SQL Database flows naturally into Power BI. Reports embedded in Teams channels where discussions happen.
Enterprise governance matters.
Row-level security, certified datasets, endorsed content, centralized monitoring. Power BI’s enterprise features are mature and comprehensive. IT can manage who sees what data, audit usage, control costs.
You need mobile-first dashboards.
Power BI’s mobile apps for iOS and Android are excellent. Executives can review dashboards on phones or tablets with touch-optimized interfaces. Copilot is available on mobile for quick questions.
Scheduled, recurring reports are your primary need.
“Every Monday morning, executives get the weekly sales dashboard with refreshed data.” Power BI excels at this. Set up refresh schedules, configure email subscriptions, automate distribution.
You’re building apps for non-technical users.
Power BI lets you package reports into apps with custom branding and navigation. End users get a curated experience without seeing the underlying complexity.
Your team has established BI roles.
Data engineers build semantic models, BI developers create reports, business analysts consume them. Power BI’s separation of concerns supports this structure.
Livedocs Makes Sense When:
Your team needs to move fast.
Startups, agencies, internal analytics teams supporting product development. You’re exploring data, testing hypotheses, iterating quickly. Livedocs’ speed, from question to insight in seconds, matters more than polished dashboards.
Technical and non-technical people work together.
Product managers, marketers, and data analysts collaborating on the same analysis. AI levels the playing field. Non-technical folks ask questions, technical teammates refine when needed.
Custom analysis is the norm, not the exception.
Your work doesn’t fit neatly into dashboard templates. You need to write Python for statistical models, combine SQL with data transformations, or integrate external APIs. Livedocss gives you code flexibility without requiring everyone to be coders.
Real-time collaboration is essential.
Remote teams across time zones. Multiple people need to work on the same analysis simultaneously, building on each other’s work. Google Docs-style editing is invaluable.
You want to document analysis and insights together.
The notebook format naturally combines code, visualizations, and narrative explanations. Your analysis artifact is also your documentation.
Setup and maintenance overhead is a problem.
Small teams without dedicated data engineering. You can’t spend weeks setting up infrastructure or managing environment conflicts. Livedocs’ cloud-native approach eliminates that overhead.
AI assistance with your actual data is the goal.
Not generic AI that helps you learn Power BI, AI that understands your specific schema and can answer questions about your actual business data.
Multiple people need to work on the same analysis simultaneously, building on each other’s work. Google Docs-style editing is invaluable.
The Learning Investment
How long before your team is productive?
Power BI Learning Curve
Basic proficiency: 1-2 months for simple reports and dashboards. You’ll learn to connect data, create visuals, apply filters, and publish to the Service.
Intermediate skills: 3-6 months. Data modeling, relationships, DAX basics, row-level security, creating calculated measures. You’re building production-quality dashboards.
Advanced capabilities: 6-12+ months. Complex DAX, performance optimization, advanced data modeling, Power Query M language, managing enterprise deployments.
Microsoft provides extensive free training through Microsoft Learn, and there’s a huge ecosystem of courses, books, and certifications. The Power BI community is massive, answers to almost any question exist somewhere.
The challenge? Depth. Power BI is powerful, which means complexity. DAX alone is a significant learning investment. Data modeling concepts require understanding star schemas, fact tables, dimension tables. For business users focused on consuming reports, the learning curve is minimal. For developers building reports, expect a real investment.
Livedocs Learning Curve
Basic proficiency: Hours to days. If you can ask questions in English, you can use Livedocs. Type “show me monthly revenue,” get a chart. The AI handles technical details.
Intermediate skills: Weeks. Learning to ask better questions, understanding when to review AI-generated code, combining SQL and Python cells, structuring notebooks effectively.
Advanced capabilities: The ceiling is high because you have full Python and SQL access. But reaching advanced use doesn’t require mastering everything, AI assists even with complex tasks.
The learning curve is inverted compared to Power BI. You’re productive immediately but continuously discover more powerful capabilities as you go. The challenge? Learning to work with AI effectively, which is a newer skill set than traditional BI development.
For teams with mixed skill levels, Livedocs’ AI-first approach means everyone can contribute from day one. Technical teammates still add value by refining AI output and handling edge cases, but the baseline productivity is higher.
The Technical Capabilities Comparison
Data Connectivity
Power BI: 150+ certified connectors (databases, cloud services, files, APIs). Power Query for data transformation. DirectQuery for real-time data without importing. On-premise data gateway for connecting to local databases.
Livedocs: Built-in connectors for major databases (PostgreSQL, Snowflake, BigQuery, ClickHouse, etc.). File uploads (CSV, JSON, Parquet, Excel). You can also write Python to connect to anything programmatically.
Verdict: Power BI has broader out-of-the-box connectivity. Livedocs is more flexible if you’re comfortable writing code for custom connections.
Data Transformation
Power BI: Power Query (M language) for transforming data before loading. GUI-based transformations with code generation. Dataflows for reusable ETL.
Livedocs: Full Python (pandas, numpy) and SQL for transformations. AI can generate transformation code based on natural language instructions.
Verdict: Power BI’s Power Query is more accessible for non-coders. Livedocs offers more flexibility for complex transformations.
Visualization
Power BI: Extensive built-in visuals, custom visuals marketplace (AppSource), highly customizable formatting. Mobile-optimized layouts.
Livedocs: Python plotting libraries (matplotlib, plotly, seaborn), SQL result visualization, chart types via AI generation. Less granular formatting control.
Verdict: Power BI wins on visual polish and variety. Livedocs is more functional than flashy.
Advanced Analytics
Power BI: DAX for calculated measures and columns. R and Python integration (but requires separate setup). Azure Machine Learning integration. Copilot-assisted insights.
Livedocs: Native Python support means full access to scikit-learn, tensorflow, scipy, statsmodels. AI can help write machine learning code. SQL for analytical queries.
Verdict: Livedocs offers more flexibility for custom analytics and machine learning workflows.
Performance
Power BI: Optimized for large datasets with Direct Lake storage mode (50%+ performance improvements in 2025). Aggregations and caching for fast dashboard loads.
Livedocs: Performance depends on compute allocation (2-4 vCPU in standard plans). Direct database queries mean performance tied to database speed.
Verdict: Power BI is more optimized for serving dashboards at scale. Livedocs is fast for exploratory analysis but less optimized for high-concurrency viewing.
So Which Tool Should You Choose?
Here’s the truth: Power BI is the safer, more established choice. It’s proven at enterprise scale, integrates with your existing Microsoft stack, has mature governance features, and offers a clear career path for BI professionals. If you need to justify your choice to stakeholders, Power BI’s track record makes that easy.
But “safe” doesn’t always mean “best.” Power BI was designed for an era when business intelligence meant publishing polished reports for consumption. The collaboration model, the Desktop-to-Service workflow, the separation between developers and consumers, these reflect 2015’s assumptions about how data work happens.
Livedocs represents a newer philosophy: that data work should be collaborative, iterative, and AI-assisted. That the line between technical and non-technical is blurring. That the artifact shouldn’t be a finished dashboard but a living document that explores, explains, and updates.
For modern data teams, especially smaller, agile teams where everyone needs to explore data together, Livedocs’ approach feels more natural. The Google Docs-style collaboration, the AI that understands your data, the code flexibility when you need it but abstraction when you don’t, these aren’t just nice features, they change how teams work.
Choose Power BI if:
- You’re in the Microsoft ecosystem (Azure, Teams, Office 365)
- Enterprise governance and security are primary concerns
- You need mobile-first, polished dashboards for executives
- Your team has established BI roles (data engineers, BI devs, business users)
- Scheduled reporting and data distribution are core use cases
- You’re building for end users who’ll consume but not create
- Industry standards and proven ROI matter for budget approval
Choose Livedocs if:
- Speed and agility matter more than polish
- Your team includes both technical and non-technical people who need to collaborate
- Custom analysis that doesn’t fit dashboard templates is common
- Real-time collaboration is essential for your workflow
- You want AI that understands your specific data, not just assists with software
- Setup and maintenance overhead is a constraint
- Code flexibility matters but you don’t want everyone writing code manually
- You’re comfortable with a newer tool that’s still building its feature set
LiveDocs represents a newer philosophy: that data work should be collaborative, iterative, and AI-assisted.
Final Thoughts
Livedocs is betting that AI fundamentally changes how we work with data. That prompting will replace clicking, that collaboration matters more than polish, that notebooks are better artifacts than dashboards. They’re building for how startup data teams work today, assuming larger organizations will eventually work that way too.
What’s certain: data work in 2030 will look different than 2020. AI isn’t going away. Collaboration is increasingly essential. The tools that win will be those that make complex things simple without sacrificing power.
The question isn’t which is better, it’s which matches how you want your team to work.
Get started with Livedocs and build your first live notebook in minutes.
- 💬 If you have questions or feedback, please email directly at a@livedocs.com
- 📣 Take Livedocs for a spin over at livedocs.com/start. Livedocs has a great free plan, with $10 per month of LLM usage on every plan
- 🤝 Say hello to the team on X and LinkedIn
Stay tuned for the next tutorial!
Ready to analyze your data?
Upload your CSV, spreadsheet, or connect to a database. Get charts, metrics, and clear explanations in minutes.
No signup required — start analyzing instantly

