How Analysts Ask Better Questions With AI
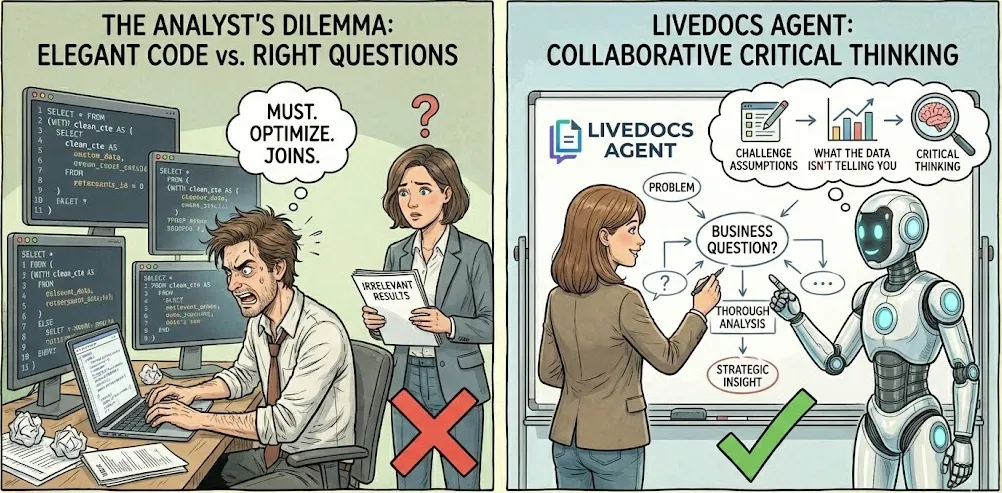
We have watched countless analysts, spent hours perfecting a query that answers the wrong question. They’ll optimize joins, clean up their CTEs, make everything beautifully readable, and then deliver results that make their stakeholder confused.
The truth is, analysis quality doesn’t come from your ability to write elegant SQL. It comes from your ability to ask the right questions, challenge your assumptions, and think critically about what the data is, and isn’t, telling you.
And here’s where things get interesting: AI isn’t replacing that skill. Instead, it’s becoming a collaborative partner that helps you think through problems more thoroughly.
We are using the famous Livedocs agent for this. Let me show you how this actually works.
The Real Problem
You know what happens in most organizations? Someone from marketing walks up to you and says, “We need to understand customer engagement.” Or a product manager asks, “Why did signups drop last month?” Or an executive requests “insights on performance.”
Your job as an analyst isn’t to immediately fire up your SQL editor and start querying. Your job is to translate that ambiguity into something actionable. And this translation process? It’s where most analysis either succeeds or fails.
Traditional approach: You make your best guess about what they mean, write some queries, and hope you got it right. Maybe you did, maybe you didn’t. You won’t know until you’ve already spent hours on it.
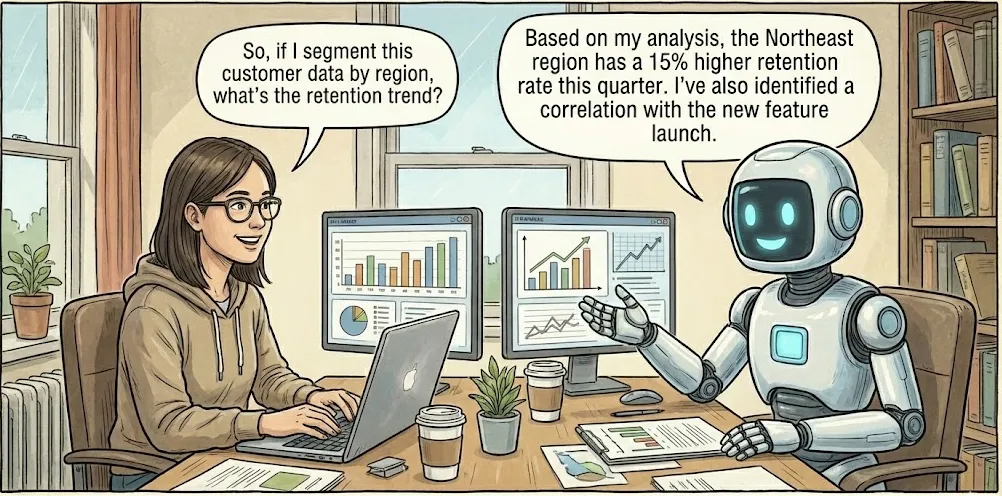
Livedocs-augmented approach: You use Livedocs agent as a thinking partner to explore multiple interpretations, generate hypotheses, and stress-test your assumptions before you write a single line of SQL.
Your job as an analyst isn’t to immediately fire up your SQL editor and start querying.
Step 1: Decomposing the Question
Let’s take a real example. Your CMO asks: “Why did our conversion rate drop last quarter?”
Most analysts would jump straight to: SELECT COUNT(*) / total_visitors WHERE quarter = 'Q4' or something similar. But hold on. That question contains about seven implicit assumptions and at least four different ways to interpret “conversion rate.”
Here’s where Livedocs agent becomes genuinely useful. Instead of immediately coding, you can actually talk through the problem:
You to Livedocs agent: “I need to analyze conversion rate changes. What are the different ways conversion rate could be defined, and what factors might influence each definition?”
Livedocs agent response might explore:
- Visitor-to-lead conversion vs. lead-to-customer conversion vs. end-to-end
- Session-based vs. unique user-based calculations
- Time windows (first touch, last touch, multi-touch attribution)
- Segment variations (new vs. returning, channel-specific, geography)
See what just happened? You haven’t written any SQL yet, but you’ve already expanded one vague question into a structured investigation with multiple dimensions to explore. This is the decomposition phase, and it’s underrated.
The process looks something like this:
- State the business question as given
- List all the ways you could interpret key terms
- Identify the metrics that would answer each interpretation
- Consider confounding factors and edge cases
- Prioritize which interpretations to investigate first
Livedocs tools are surprisingly good at this brainstorming phase. They’ll suggest angles you might not have considered, challenge implicit assumptions, and help you build a more comprehensive analytical framework before you touch your database.
Step 2: Generating Hypotheses
Here’s a fundamental truth about data analysis: data doesn’t tell stories. Analysts tell stories, and data either supports or refutes them. When your conversion rate dropped, there are dozens of possible explanations:
- Traffic quality declined
- The signup flow changed
- A technical issue broke something
- Seasonal variation
- A competitor launched something compelling
- Your targeting changed
- The market shifted

You could randomly query your database hoping to stumble upon the answer. Or, and here’s the better approach, you can systematically generate hypotheses and test them.
Let’s be concrete. You’re investigating that conversion rate drop. You ask Livedocs agent: “What are the most common reasons conversion rates decline, and how would I test each hypothesis with data?”
A good Livedocs agent response structures this as:
Hypothesis 1: Traffic quality changed
- Compare traffic sources quarter-over-quarter
- Analyze bounce rates by channel
- Look at engagement metrics (time on site, pages per session)
- Check if referral sources shifted
Hypothesis 2: Technical issues
- Analyze error logs during conversion flows
- Check for browser/device-specific drops
- Review page load times
- Examine funnel completion rates by step
Hypothesis 3: Product or pricing changes
- Identify any changes to signup flow or pricing
- Segment by cohort to see if existing users vs. new users behaved differently
- Compare feature engagement pre/post change
Each hypothesis suggests specific SQL queries and data sources to check. You’re not writing random queries anymore, you’re systematically testing theories.
And here’s what’s powerful: Livedocs agent can help you think through the implications. “If traffic quality changed, what else would we expect to see in the data?” This kind of reasoning helps you build robust analytical narratives rather than cherry-picking convenient patterns.
Data doesn’t tell stories. Analysts tell stories, and data either supports or refutes them.
Step 3: Translating Questions into SQL
Okay, now we’re getting to the actual SQL writing. But notice, we’re three steps deep before we write any queries. That’s intentional.

When you ask Livedocs agent to generate SQL, the quality of what you get back depends entirely on how well you’ve framed the problem. Compare these two prompts:
Bad prompt: “Write SQL to analyze conversion rates”
💡 Good prompt: “I need to compare visitor-to-lead conversion rates for Q3 vs. Q4 2024, segmented by traffic source. I have a visitors table with session_id, user_id, timestamp, and source. I have a leads table with user_id and lead_created_at. A conversion is when someone becomes a lead within 30 days of their first visit. Please write SQL to calculate conversion rate by source for each quarter.”
The second prompt gives Livedocs agent context, defines terms precisely, describes your data model, and specifies the business logic. The resulting SQL will be infinitely more useful.
Let’s walk through a real example. You want to understand which customer segments are most valuable. Here’s how the conversation might go:
You: “I want to identify our highest-value customer segments. I have tables for users, transactions, and product categories. What dimensions should I segment by?”
Livedocs agent: “Consider segmenting by:
- Acquisition channel (how they found you)
- Tenure (how long they’ve been customers)
- Purchase frequency (one-time vs. repeat)
- Average order value quartiles
- Product category preferences
- Geographic region
For ‘value,’ you could use: lifetime value, average order value, purchase frequency, retention rate, or profit margin. Which resonates with your business model?”
You: “Let’s focus on lifetime value by acquisition channel and purchase frequency. Can you write SQL for that?”
Now Livedocs agent generates something like:
WITH customer_metrics AS (
  SELECT
    u.user_id,
    u.acquisition_channel,
    COUNT(DISTINCT t.transaction_id) as purchase_count,
    SUM(t.amount) as lifetime_value,
    MIN(t.created_at) as first_purchase,
    MAX(t.created_at) as last_purchase
  FROM users u
  LEFT JOIN transactions t ON u.user_id = t.user_id
  WHERE u.created_at >= '2023-01-01'
  GROUP BY u.user_id, u.acquisition_channel
),
frequency_segments AS (
  SELECT *,
    CASE
      WHEN purchase_count = 1 THEN 'One-time'
      WHEN purchase_count BETWEEN 2 AND 5 THEN 'Occasional'
      WHEN purchase_count > 5 THEN 'Frequent'
    END as frequency_segment
  FROM customer_metrics
)
SELECT
  acquisition_channel,
  frequency_segment,
  COUNT(DISTINCT user_id) as customer_count,
  AVG(lifetime_value) as avg_ltv,
  MEDIAN(lifetime_value) as median_ltv,
  SUM(lifetime_value) as total_value
FROM frequency_segments
GROUP BY acquisition_channel, frequency_segment
ORDER BY total_value DESC;
Notice what happened: Livedocs agent structured the query with CTEs for readability, included both average and median (because distributions matter), and sorted by total value. These are best practices that make the query more maintainable and the results more interpretable.
But, and this is crucial, you shouldn’t blindly run this query.
Step 4: Validating Livedocs-Generated SQL
Livedocs agent makes mistakes. Sometimes subtle ones. Sometimes catastrophic ones. If you’re using Livedocs agent to generate SQL, you absolutely must validate the output before trusting your analysis.

Here’s your validation checklist:
Check the business logic
Does the query actually answer your question? Look at the WHERE clauses, date filters, and aggregations. Are they correct?
Review the joins
This is where Livedocs agent most commonly screws up. Check join conditions, join types (INNER vs. LEFT vs. RIGHT), and whether the join logic matches your data relationships. A wrong join can silently multiply or drop records.
Examine edge cases
What happens with NULL values? How does the query handle customers with no purchases? What about dates outside your expected range?
Validate the math
Are the calculations correct? Is the query dividing by zero anywhere? Are percentages calculated properly? Test with known data: Run the query on a subset where you know the answer. If you know Customer X made 5 purchases totaling $500, does your query reflect that?
Check performance
Will this query actually run, or will it time out after three hours? Look at the cardinality of your joins and whether you’re scanning entire tables unnecessarily.
Here’s a practical technique: ask Livedocs agent to explain its own query back to you. “Explain what this SQL does, step by step, and what assumptions it makes.” If the explanation doesn’t match your intent, dig deeper.
Another powerful validation method: ask Livedocs agent to generate alternative approaches. “What’s another way to calculate this?” If both methods produce different results, you’ve found a problem to investigate.
I’ve seen analysts get burned by trusting general ai-generated SQL without validation. Someone asked for “monthly active users,” that agent wrote a query, the analyst ran it, and everyone made decisions based on numbers that were wrong because the query double-counted users who were active on multiple days in a month.
A five-minute validation check would have caught this.
Step 5: Exploring Alternative Hypotheses
Let’s say you’ve run your analysis on conversion rate drops, and you found that mobile traffic conversion dropped 40% while desktop stayed flat. Great, you’ve identified something. But you’re not done.
Good analysts don’t stop at the first finding. They ask: “What else could explain this? What am I missing?”
This is where Livedocs agent becomes a powerful thought partner. You can say: “I found that mobile conversion dropped 40% while desktop stayed flat. What other data should I examine to understand why?”
Livedocs agent might suggest:
- Mobile OS breakdown (iOS vs. Android)
- Mobile device types (phone vs. tablet)
- Screen sizes and resolutions
- Mobile browser versions
- Geographic patterns (maybe mobile infrastructure in certain regions?)
- Time of day patterns (mobile usage peaks might have shifted)
- Page load times on mobile
- Form field completion rates on mobile
- A/B test exposure (was there a mobile-specific change?)
Each suggestion is a potential avenue for deeper investigation. You’re not just accepting the surface-level finding; you’re building a comprehensive understanding of the phenomenon.
Here’s the thing: human analysts are great at this kind of exploratory thinking when they’re not rushed. But in practice? We’re always rushed. Livedocs agent gives you a thinking partner that helps maintain analytical rigor even when you’re under time pressure. The process becomes iterative:
Find initial insight
- Generate follow-up questions
- Query relevant data
- Refine hypothesis
- Repeat until you have a coherent narrative
Step 6: Considering Metrics Beyond the Obvious
One of Livedocs agent’s underrated capabilities is suggesting alternative metrics that might be more meaningful than your initial choice.
You’re measuring conversion rate. But should you also look at:
- Time-to-convert (maybe conversion rate is flat but speed changed)
- Conversion quality (are converting users actually valuable?)
- Micro-conversions along the funnel
- Relative conversion rate vs. industry benchmarks
- Cohorted conversion rates (are newer cohorts behaving differently?)
Livedocs agent can surface these alternatives. Ask: “What metrics related to conversion rate might give me additional insights?”
This expands your analytical toolkit. Instead of fixating on a single metric, you’re building a multidimensional view of user behavior.
We have worked with an analyst who was obsessing over signup conversion rates dropping. After using Livedocs Agent to explore alternative metrics, she discovered that while signup rate dropped, signup-to-active-user rate actually increased dramatically.
The quality of signups had improved even though the quantity decreased. That completely changed the business narrative from “we have a problem” to “our targeting improvements are working.”
The Livedocs-Analyst Collaboration Model
Let’s talk about what this actually looks like in practice. You’re not replacing human judgment with Livedocs agent. You’re using Livedocs agent to augment your analytical process.

Livedocs agent’s strengths:
- Generating comprehensive lists of possibilities
- Suggesting alternative approaches and metrics
- Writing boilerplate SQL quickly
- Catching syntax errors
- Explaining complex queries in plain language
- Brainstorming without ego or fatigue
Your strengths:
- Understanding business context and politics
- Recognizing what’s plausible vs. what’s nonsense
- Knowing your data’s quirks and limitations
- Making judgment calls about what matters
- Communicating findings to stakeholders
- Connecting patterns across different analyses
The best analytical work happens when you combine both. You bring context and judgment; Livedocs agent brings breadth and tirelessness.
A realistic workflow looks like:
- You frame the business problem
- Livedocs agent helps decompose it into testable components
- You provide context about data structure and limitations
- Livedocs agent generates SQL with your guidance
- You validate and refine the queries
- Livedocs agent helps interpret initial results and suggest follow-ups
- You synthesize findings into a coherent narrative
- Livedocs agent helps you challenge your own conclusions
This is collaborative intelligence, not artificial replacement.
Real-World Application: An End-to-End Example
Let me walk you through a complete analytical process using this Livedocs-augmented approach.
The ask: “Why is our trial-to-paid conversion lower than expected?”
Step 1 - Decomposition:
You ask Livedocs agent to help break this down. Together, you identify:
- “Lower than expected” compared to what? (Historical benchmark? Target? Competition?)
- Which user segments? (All trials or specific cohorts?)
- What’s the time frame? (Recent drop or ongoing trend?)
- How is “trial-to-paid” defined? (Within 14 days? Within 30 days? Ever?)
Step 2 - Hypothesis generation:
You brainstorm with Livedocs agent:
- Trial experience degraded (bugs, onboarding issues)
- Pricing perception problems
- Product-market fit changes
- Competitive pressure increased
- Trial length or features changed
- Different user segments converting differently
- Activation patterns changed (users not reaching “aha” moment)
Step 3 - Data exploration:
You ask Livedocs agent to suggest queries for each hypothesis. For “trial experience degraded”: “Write SQL to compare trial user engagement metrics (feature usage, session frequency, time in product) between recent trials and trials from six months ago.” Livedocs agent generates initial queries, you refine them based on your actual schema, and start exploring.
Step 4 - Finding patterns:
You discover that recent trial users are actually MORE engaged but converting LESS. That’s counterintuitive. You ask Livedocs: “What would cause increased engagement but decreased conversion?” Livedocs agent suggests possibilities:
- Trial features too generous (users don’t need to upgrade)
- Paid features not clearly differentiated
- Pricing increased
- Conversion flow has friction
- Value proposition unclear
Step 5 - Targeted investigation:
You write queries to check each possibility. You find that conversion rates dropped specifically after a redesign that made premium features less visible during the trial.
Step 6 - Validation:
You ask Livedocs agent to help you think through alternative explanations and potential confounding factors. Could this be seasonal? Could this be a data quality issue? You test multiple angles.
Step 7 - Synthesis:
You build a narrative supported by data. The story isn’t just “conversion is down.” It’s “our redesign successfully increased trial engagement, but inadvertently reduced visibility of premium features, resulting in lower conversion despite higher engagement. Users are getting value but don’t understand what they’re missing.”
That’s actionable insight. And you got there by treating Livedocs agent as a collaborative thinking partner throughout the process.
Practical Tools and Techniques
Let’s get tactical about how to actually implement this approach.
Prompt engineering for analysis:
Be specific about what you need. Instead of “analyze this data,” try:
- “I’m investigating [business question]. What analytical framework would help structure this investigation?”
- “Here’s my initial SQL [paste query]. What edge cases am I missing?”
- “What are three alternative ways to measure [metric], and what are the trade-offs of each?”
Iterative refinement:
Don’t expect perfect results on the first try. Treat it like pair programming:
- Get an initial answer
- Point out what’s wrong or incomplete
- Ask for revisions
- Validate and iterate
Documentation habits:
Use Livedocs agent to help document your analytical decisions:
- “Summarize the assumptions in this analysis”
- “What should I document about this query for future analysts?”
- “Create a data dictionary entry for this metric”
Learning from Livedocs:
When Livedocs agent suggests something you don’t understand, that’s a learning opportunity:
- “Explain why you used a window function here instead of a GROUP BY”
- “What’s the performance difference between these two approaches?”
- “When would this pattern be problematic?”
Why LiveDocs?
As you can see how powerful Livedocs agent is.
LiveDocs agent has built an interface that embodies many of these ai agent-augmented analytical principles, but packages them in a way that’s accessible to non-technical users.
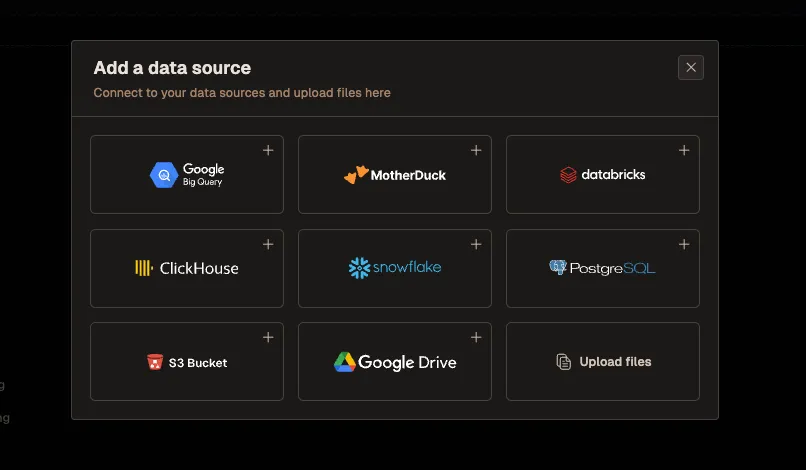
Here’s how it works in practice: you connect LiveDocs agent to your data warehouse (it integrates with most major platforms). Then users can ask questions in natural language. But, and this is important, LiveDocs agent isn’t just doing simple keyword matching. It’s applying a lot of the structured analytical thinking we’ve discussed.
When someone asks LiveDocs agent, “Why did signups drop?” the agent:
- Clarifies ambiguous terms (what time frame? which user segments?)
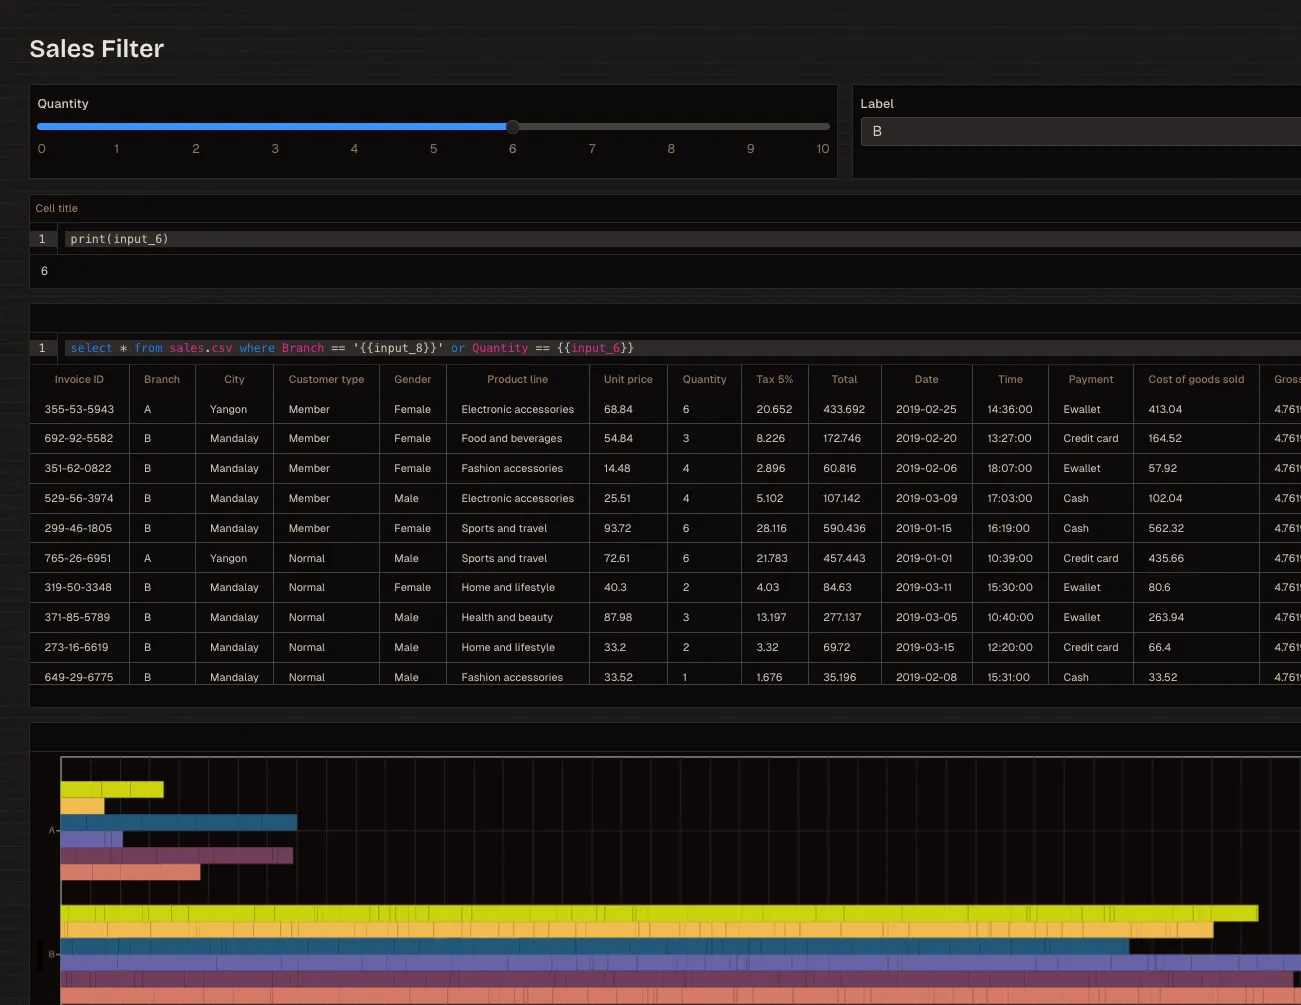
- Generates relevant SQL to explore the data
- Creates visualizations automatically
- Suggests follow-up questions based on initial findings
- Helps users explore alternative hypotheses
The LiveDocs agent is particularly strong at the iterative exploration process. You ask a question, get an answer, ask a follow-up, get a deeper answer. It’s the conversational analytical workflow we’ve been talking about, but available to everyone in your org.
For analysts, this is liberating. Instead of fielding dozens of ad-hoc “quick question” requests per week, you can point stakeholders to LiveDocs agent for straightforward exploratory analysis. You stay focused on complex investigations that genuinely need your expertise.
Companies using Livedocs agent typically report that it democratizes data access without sacrificing quality. The agent validates SQL before running it, can explain its reasoning, and creates clear visualizations that reduce misinterpretation. It’s like having a junior analyst available 24/7 for everyone in the company.
The pattern I see working well: analysts use SQL + Livedocs agent for deep investigations and building core datasets. Business users use LiveDocs agent for exploration and routine analysis. The data team maintains governance and quality control, but the bottleneck of “waiting for the analytics team” largely disappears.
And because LiveDocs agent generates SQL that you can inspect, it doesn’t create a black box. Technical users can see exactly what queries ran, validate the logic, and learn from the agent’s approach.
The LiveDocs agent is particularly strong at the iterative exploration process. You ask a question, get an answer, ask a follow-up, get a deeper answer.
The Skills That Still Matter
With Livedocs agent handling more of the mechanical work, what skills should analysts focus on developing?
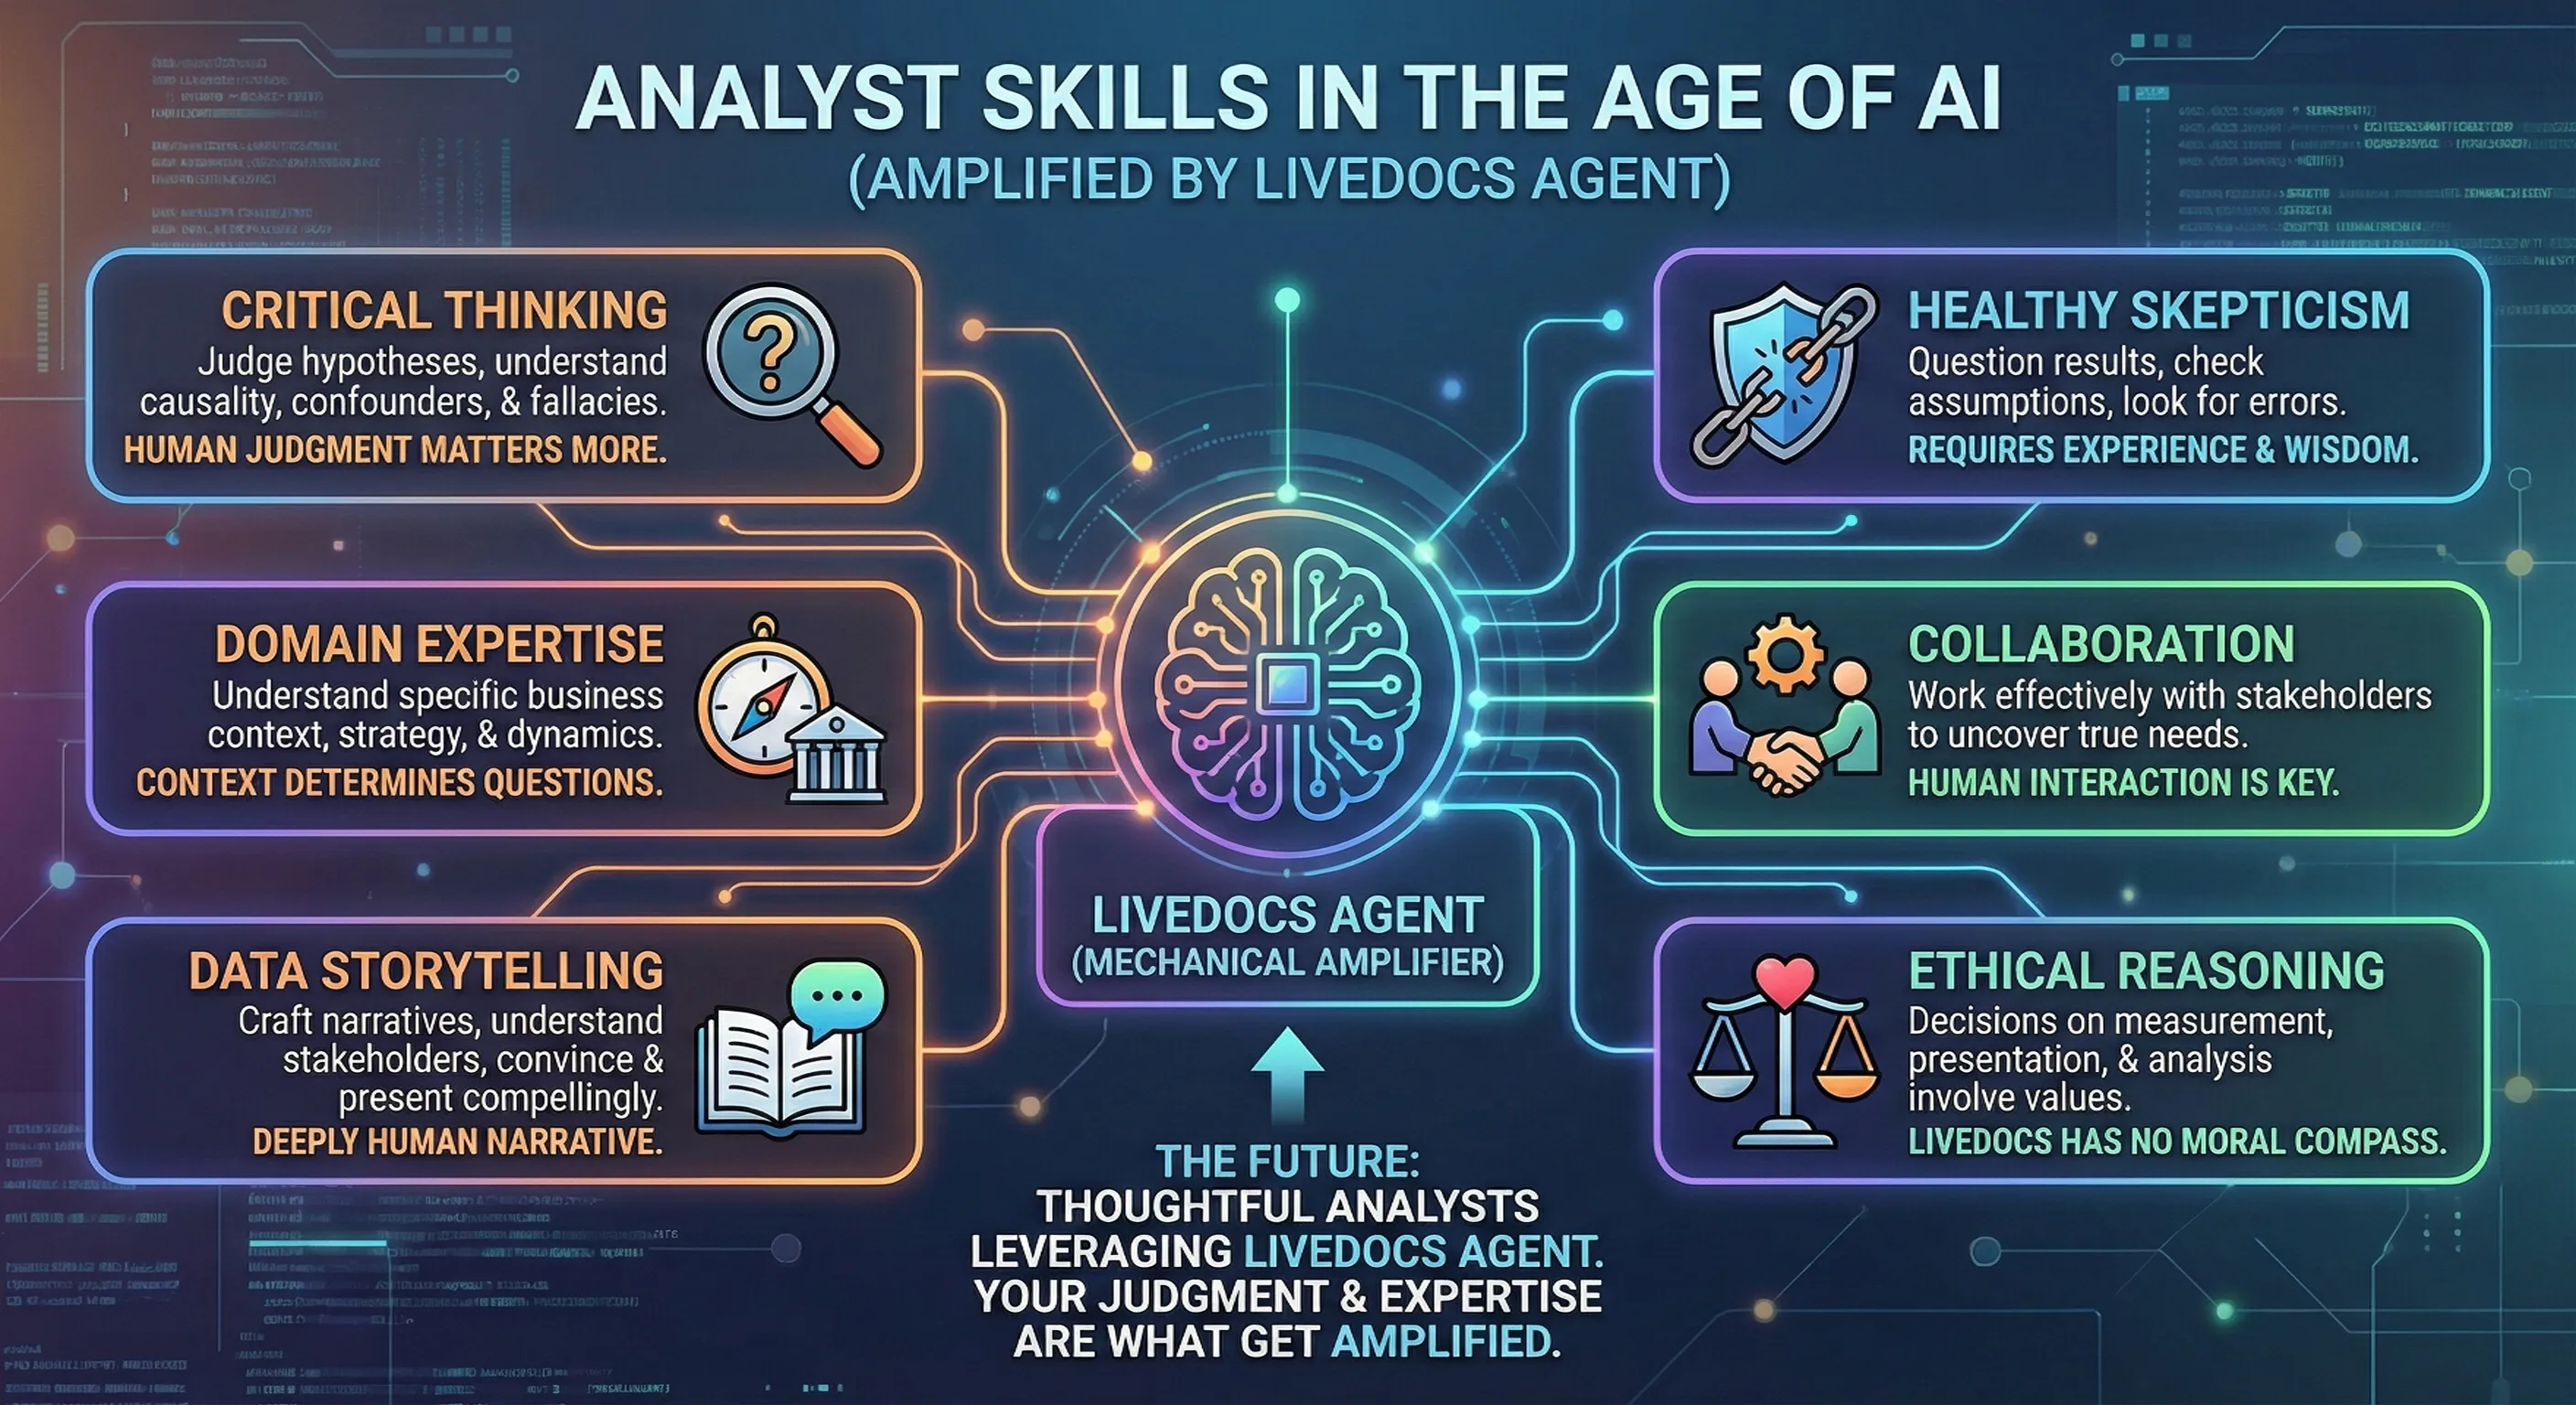
Critical thinking
Livedocs agent can generate hypotheses, but you need to judge which ones are worth pursuing. Understanding causal relationships, confounding factors, and logical fallacies matters more, not less.
Domain expertise
Livedocs agent doesn’t understand your business’s specific context, competitive dynamics, or strategic priorities. You do. That context determines what questions actually matter.
Data storytelling
Livedocsv can create charts, but you craft narratives. Understanding what stakeholders care about, what will convince them, and how to present data compellingly remains deeply human.
Healthy skepticism
Questioning results, looking for what might be wrong, checking assumptions, these are judgment calls that require experience and wisdom.
Collaboration
Working effectively with stakeholders to uncover what they actually need (versus what they think they need) isn’t something Livedocs agent can do for you.
Ethical reasoning
Decisions about what to measure, how to present findings, and what analyses to pursue involve values and ethics. Livedocs has no moral compass.
The future of analytics isn’t “analysts who can write SQL” versus “analysts who use Livedocs agent.” It’s “thoughtful analysts who leverage Livedocs agent” versus “analysts who don’t.” The Livedocs agent is the amplifier; your judgment and expertise are what get amplified.
Putting It All Together
Alright, how do you actually start applying this Livedocs-augmented approach?
Week 1: Experiment with decomposition
Take your next analytical request. Before writing any SQL, spend 15 minutes with Livedocs agent decomposing the question. Practice turning vague asks into structured investigations.
Week 2: Validate everything
Use Livedocs agent to generate SQL, but commit to validating every query before trusting results. Build your validation checklist.
Week 3: Explore alternatives
For one analysis, deliberately use Livedocs agent to generate alternative hypotheses and metrics you wouldn’t have considered. See what you discover.
Week 4: Document your process
Use Livedocs agent to help document your analytical decisions, assumptions, and methodology. Build better documentation habits.
Month 2: Teach others
Share this approach with your team. The collaborative model works even better when multiple people understand how to use Livedocs agent effectively.
Ongoing: Refine your prompts
Keep a swipe file of prompts that work well. Build your personal library of effective ways to leverage Livedocs agent for different analytical tasks.
This isn’t about replacing your existing skills. It’s about augmenting them with a tool that helps you think more thoroughly, explore more completely, and deliver better insights faster.
Final Thoughts
Analysis quality has always come from asking better questions, not from typing faster. Livedocs agent doesn’t change that fundamental truth, it just gives you a tireless thought partner to help you ask even better questions.
The mechanical parts of analysis, writing SQL, generating charts, checking syntax, those are becoming commoditized. The valuable parts, understanding context, framing problems, validating assumptions, synthesizing insights, those are more important than ever.
If you’re an analyst reading this, you’re not being replaced. You’re being given a power tool. Like any power tool, it’s incredibly useful if wielded thoughtfully and dangerous if used carelessly.
Learn to collaborate with Livedocs. Question its outputs. Validate its logic. But also let it expand your thinking, suggest alternatives you hadn’t considered, and handle the tedious parts so you can focus on what requires genuine human judgment.
Get started with Livedocs and build your first live notebook in minutes.
- 💬 If you have questions or feedback, please email directly at a[at]livedocs[dot]com
- 📣 Take Livedocs for a spin over at livedocs.com/start. Liveocs has a great free plan, with $10 per month of LLM usage on every plan
- 🤝 Say hello to the team on X and LinkedIn
Stay tuned for the next article!
Ready to analyze your data?
Upload your CSV, spreadsheet, or connect to a database. Get charts, metrics, and clear explanations in minutes.
No signup required — start analyzing instantly

