Building Notebooks with Real-Time Data
Building data notebooks that can tap into live APIs and work with real-time data used to be this massive technical headache.
You’d need to juggle authentication, handle API rate limits, wrangle different data formats, and then somehow make sense of it all before the data became stale.
But platforms like Livedocs are changing that game entirely.
Getting Started: What You Need to Know
Before we jump into the deep end, let’s talk about what makes a data notebook “live” in the first place. We’re essentially talking about notebooks that can:
- Pull fresh data from APIs on demand or on a schedule
- Handle streaming data sources that update continuously
- Refresh visualizations automatically when underlying data changes
- Run automated workflows at specific intervals
- Maintain state and credentials securely across sessions
Livedocs handles most of this complexity under the hood, which is refreshing compared to cobbling together your own infrastructure.
Setting Up Your First Live Data Source
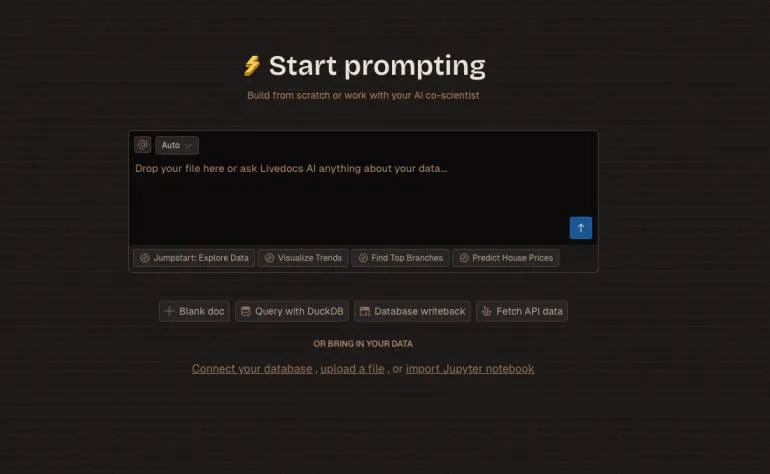
Let’s get practical. Say you want to monitor cryptocurrency prices (because let’s be real, that’s probably on your mind). Here’s how you’d set this up in Livedocs.
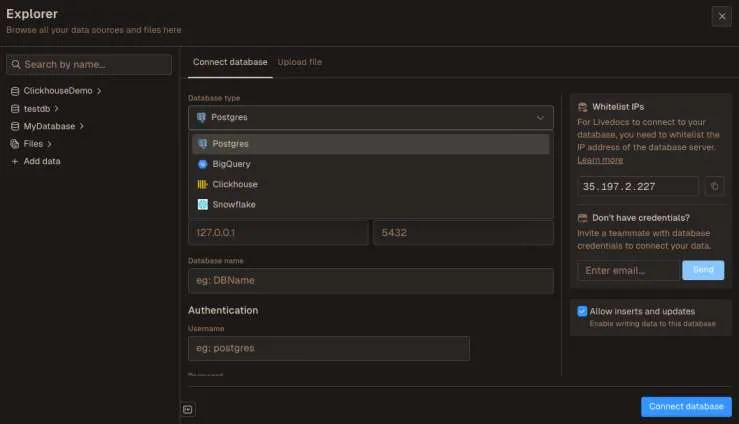
First, you’ll want to connect your API source. Livedocs supports this through Python cells, which gives you massive flexibility. You can use the Data panel to manage your connections, but Python cells let you work with literally any API that speaks HTTP.
import requests
import pandas as pd
from datetime import datetime

def fetch_crypto_data(symbol='BTC'):
    # Using CoinGecko's free API as an example
    url = f'https://api.coingecko.com/api/v3/simple/price'
    params = {
        'ids': 'bitcoin',
        'vs_currencies': 'usd',
        'include_24hr_change': 'true',
        'include_last_updated_at': 'true'
    }

    response = requests.get(url, params=params)
    data = response.json()

    return {
        'price': data['bitcoin']['usd'],
        'change_24h': data['bitcoin']['usd_24h_change'],
        'timestamp': datetime.now()
    }

# Fetch current data
current_btc = fetch_crypto_data()
print(f"Bitcoin: ${current_btc['price']:,.2f} ({current_btc['change_24h']:.2f}% 24h)")
Or you can simply ask Livedocs Agent to fetch it
Working with Secrets and API Keys
Here’s where things get serious. Most real APIs require authentication, and you definitely don’t want to hard-code your API keys into notebooks (especially if you’re sharing them with your team).
Livedocs includes a secrets manager that handles this elegantly. You can store your credentials securely and reference them in your code without ever exposing the actual values.
In the sidebar you will find a secret manager, add your API key there—let’s call it CRYPTO_API_KEY. Then in your Python cell:
import os

# LiveDocs makes secrets available as environment variables
api_key = os.getenv('CRYPTO_API_KEY')

headers = {
    'Authorization': f'Bearer {api_key}',
    'Content-Type': 'application/json'
}

# Now you can make authenticated requests
response = requests.get(api_url, headers=headers)
Now your notebook is sharable. Your teammate can run the same notebook with their own credentials.
Building Your First Live Notebook
Okay, so you’ve got data flowing in. Now what? Let’s turn that into something people actually want to look at.
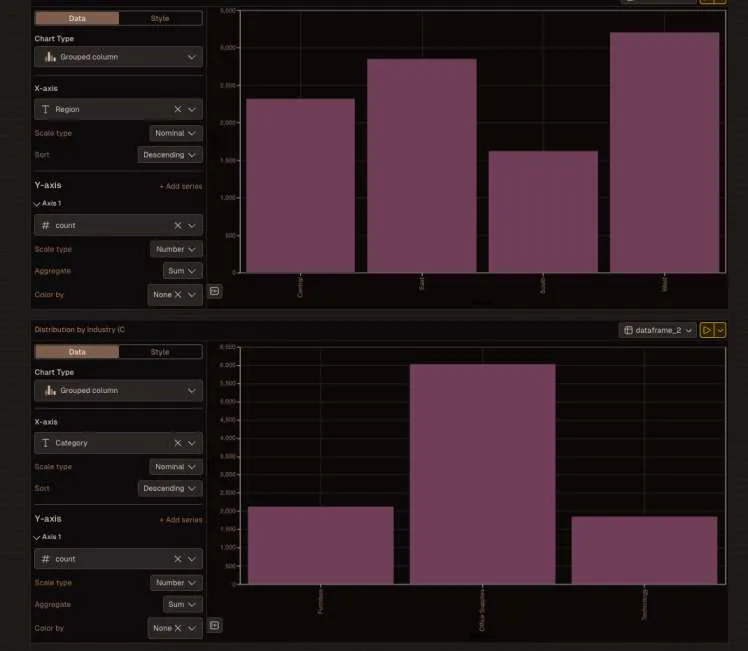
Livedocs supports multiple visualization approaches—you can write Python using libraries like Plotly or Altair, or you can use their no-code chart elements.
For a real-time crypto dashboard, you might structure it like this:
import time
import pandas as pd

# Collect data points over time
price_history = []

for i in range(10):
    data = fetch_crypto_data()
    price_history.append(data)
    time.sleep(60)  # Wait 1 minute between calls

df = pd.DataFrame(price_history)
Livedocs supports multiple visualization approaches—you can write Python using libraries like Plotly or Altair, or you can use their no-code chart elements.
Chart Element:
You can then create a chart element that references your df variable. Livedocs automatically makes variables from Python cells available to other elements in your document. The chart updates whenever you re-run the collection cell.
But here’s the really cool part: you can schedule this notebook to run automatically.
Scheduling and Automation: Making It Actually Live
Static notebooks are fine, but real-time notebooks need to stay fresh without you babysitting them. Livedocs lets you schedule document runs, think of it like cron jobs, but way easier to set up.
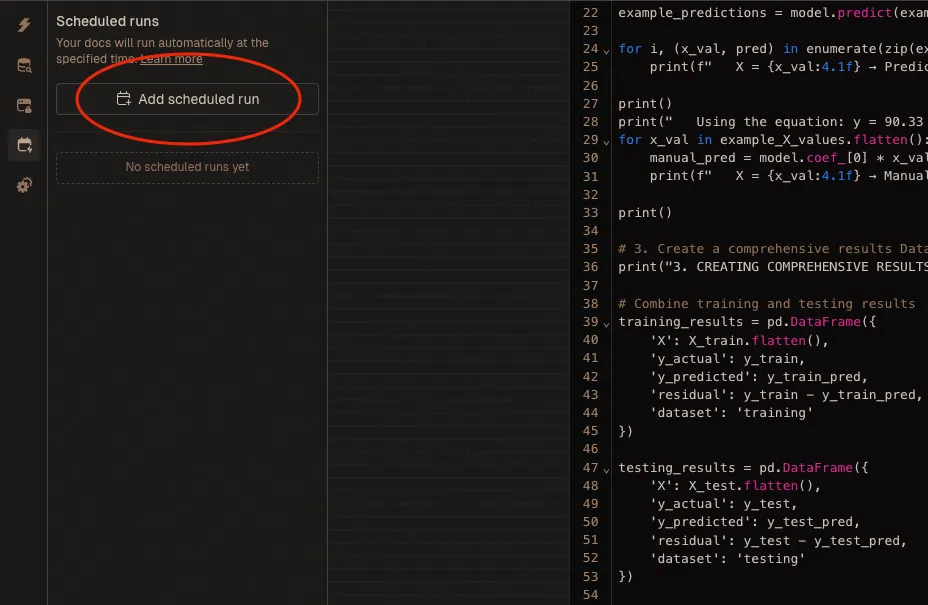
In the document settings, you can configure scheduled runs:
- Daily at 9 AM for morning reports
- Every hour for monitoring dashboards
- Every 5 minutes for critical metrics (though watch those API rate limits)
You can even set up notifications. Get an email when your scheduled run completes successfully, or—more importantly, when it fails.
Handling Streaming Data and Continuous Updates
Now, scheduled runs are great for periodic updates, but what about truly real-time, streaming data? Think WebSocket connections, server-sent events, or message queues.
Livedocs runs on actual server infrastructure with persistent connections, which means you can handle streaming data properly. Here’s a pattern that works well:
import asyncio
import websockets
import json

async def stream_market_data():
    uri = "wss://stream.example.com/market"

    async with websockets.connect(uri) as websocket:
        while True:
            message = await websocket.recv()
            data = json.loads(message)

            # Process and store the data
            process_tick(data)

            # You could write to a database or update a shared variable
            await asyncio.sleep(0.1)

# Run the stream
asyncio.run(stream_market_data())
For truly continuous streams, you might want to pair Livedocs with a message queue like Kafka or a time-series database like InfluxDB. Livedocs can query these systems on demand while your streaming infrastructure handles the continuous ingestion.
Livedocs runs on actual server infrastructure with persistent connections, which means you can handle streaming data properly.
Combining Multiple Data Sources
Most real-world projects don’t use just one API—they combine data from multiple sources to get the full picture.
Maybe you’re pulling sales data from Stripe, web analytics from Google Analytics, and customer feedback from Intercom. Livedocs makes it straightforward to combine these:
# Fetch from multiple sources
stripe_data = fetch_stripe_metrics()
analytics_data = fetch_ga_metrics()
support_data = fetch_intercom_metrics()

# Combine using pandas or DuckDB
import duckdb

# LiveDocs includes DuckDB for lightning-fast analytics
combined = duckdb.query("""
    SELECT
        s.date,
        s.revenue,
        a.visitors,
        su.support_tickets
    FROM stripe_data s
    LEFT JOIN analytics_data a ON s.date = a.date
    LEFT JOIN support_data su ON s.date = su.date
    ORDER BY s.date DESC
""").df()
DuckDB is absurdly fast for this kind of work—we’re talking millions of rows processed in seconds. And since it’s built into Livedocs, there’s nothing extra to install or configure.
Performance Optimization: Making It Fast
Real-time data notebooks can slow down quickly if you’re not careful. Here are some tricks that actually make a difference:
Cache strategically
If some data changes hourly but you’re refreshing every minute, cache it:
from functools import lru_cache
from datetime import datetime, timedelta

@lru_cache(maxsize=128)
def get_reference_data(date_key):
    """Cache reference data that doesn't change frequently"""
    return fetch_static_reference_data()

# Use current hour as cache key
current_hour = datetime.now().strftime('%Y-%m-%d-%H')
ref_data = get_reference_data(current_hour)
Use DuckDB for aggregations. Pandas is great, but DuckDB is faster for complex aggregations:
# Instead of pandas groupby operations
# result = df.groupby('category').agg({'value': 'sum'})

# Use DuckDB
result = duckdb.query("""
    SELECT category, SUM(value) as total
    FROM df
    GROUP BY category
""").df()
Batch your API calls. Many APIs support batch requests. Use them:
# Instead of 100 individual calls
for id in user_ids:
    user_data = fetch_user(id)

# Make one batched request
all_users = fetch_users_batch(user_ids)
Real-World Use Cases
Let me throw out some scenarios where this approach really shines:
Marketing campaign monitoring.
Pull metrics from Facebook Ads, Google Ads, and your analytics platform. Track spend, conversions, and ROI in real-time. Set up alerts when campaigns underperform.
System monitoring dashboards.
Query your application logs, database metrics, and server stats. Spot performance degradations before users complain.
Financial reporting.
Combine transaction data from payment processors, inventory from your warehouse system, and projections from your financial models. Give executives live visibility into business metrics.
Customer health scoring.
Aggregate product usage data, support ticket counts, and engagement metrics. Identify at-risk customers before they churn.
The pattern is the same: connect multiple data sources, transform and combine the data, visualize it compellingly, and keep it fresh automatically.
You’re ready to share results? You can publish notebooks as interactive web apps. Non-technical stakeholders get a clean interface, while technical folks can still view the underlying code if they want.
Final Thoughts
Livedocs and platforms like it are making this accessible to teams that don’t have dedicated data engineering departments.
You don’t need to manage infrastructure, configure orchestration tools, or become a DevOps expert. You just need to know what questions to ask and which APIs hold the answers.
The best, fastest agentic notebook 2026? Livedocs.
- 8x speed response
- Ask agent to find datasets for you
- Set system rules for agent
- Collaborate
- And more
Get started with Livedocs and build your first live notebook in minutes.
- 💬 If you have questions or feedback, please email directly at a[at]livedocs[dot]com
- 📣 Take Livedocs for a spin over at livedocs.com/start. Livedocs has a great free plan, with $10 per month of LLM usage on every plan
- 🤝 Say hello to the team on X and LinkedIn
Stay tuned for the next tutorial!
Ready to analyze your data?
Upload your CSV, spreadsheet, or connect to a database. Get charts, metrics, and clear explanations in minutes.
No signup required — start analyzing instantly

