Case Study: Student Graduation Employability
Editor’s Note: This analysis was conducted using LiveDocs, an AI-powered platform for serious data work. LiveDocs helps you explore, visualize, and extract actionable insights without needing to be a data scientist.
I just analyzed 10,000 students using LiveDocs, and 83.4% of them couldn’t land a job after graduation. Not because they weren’t smart. Not because they didn’t study hard enough. The reason? Well, let me show you exactly how I discovered it and how you can run similar analyses on your own data.
To read the detailed analysis, go to this link.
—
Getting Started: Loading Your Data Into LiveDocs
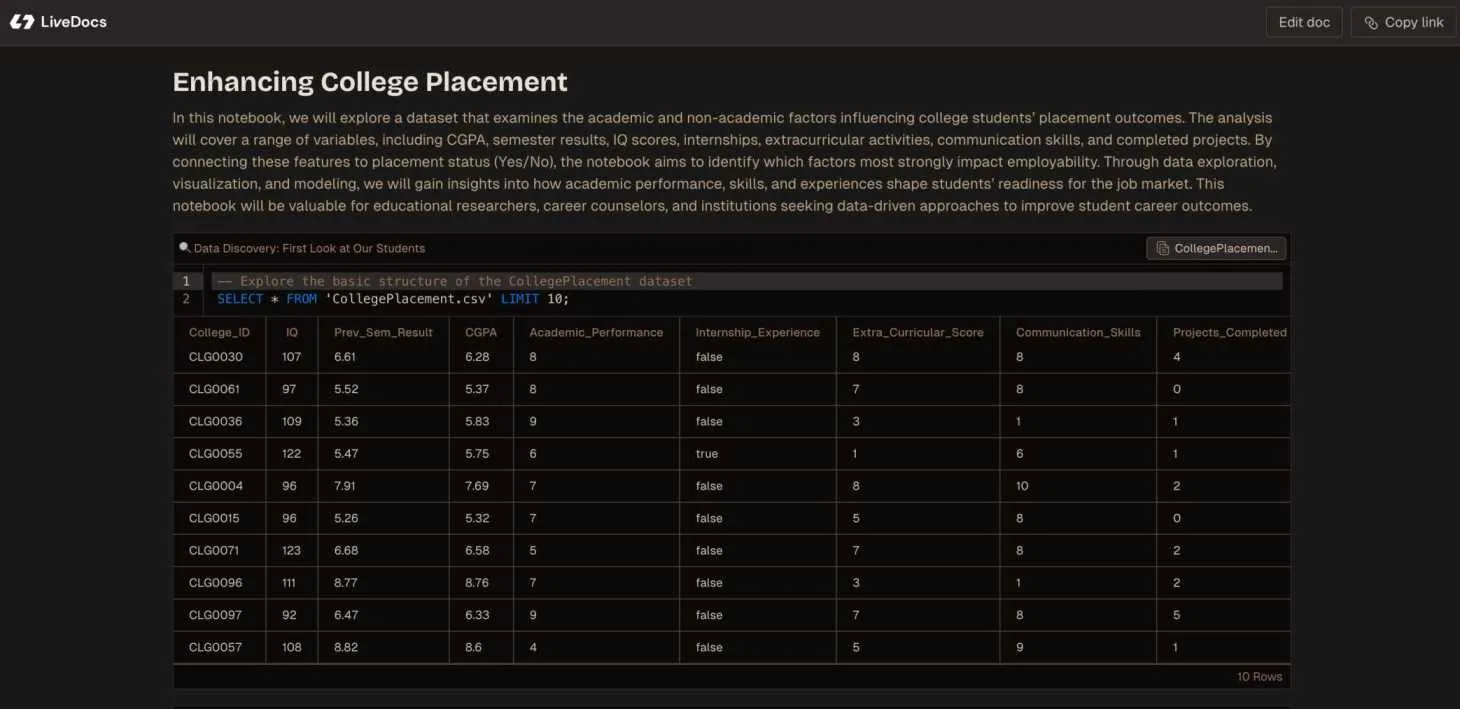
I had this massive dataset of 10,000 college students with information about their grades, communication skills, internship experience, placement outcomes, and more.
That’s where LiveDocs comes in. Unlike traditional spreadsheet tools where you’re stuck manually creating pivot tables and charts, LiveDocs lets you have a conversation with your data. You upload your dataset, and then you can literally ask it questions like “What factors predict placement success?” or “Show me the difference between placed and unplaced students.”
Step 1: Upload your CSV, Excel file, or connect your database. LiveDocs handles the heavy lifting of reading the structure.
Step 2: Ask basic questions to understand your data. I started with “What percentage of students secured placement?” The answer hit me like a brick: only 16.6%. That means 8,340 students out of 10,000 failed to get jobs.
Step 3: Let LiveDocs help you spot patterns. This is where things get interesting, and where most people give up with regular tools.
You know what I love about this approach? You don’t need to know SQL, Python, or any fancy statistical software. You just need a great prompt.
—
Running Correlation Analysis: Finding What Actually Matters
In traditional analysis, you’d need to manually run correlation tests, probably in R or Python, and interpret a bunch of statistical outputs. With LiveDocs, I literally asked: “What factors are most strongly correlated with placement success?”
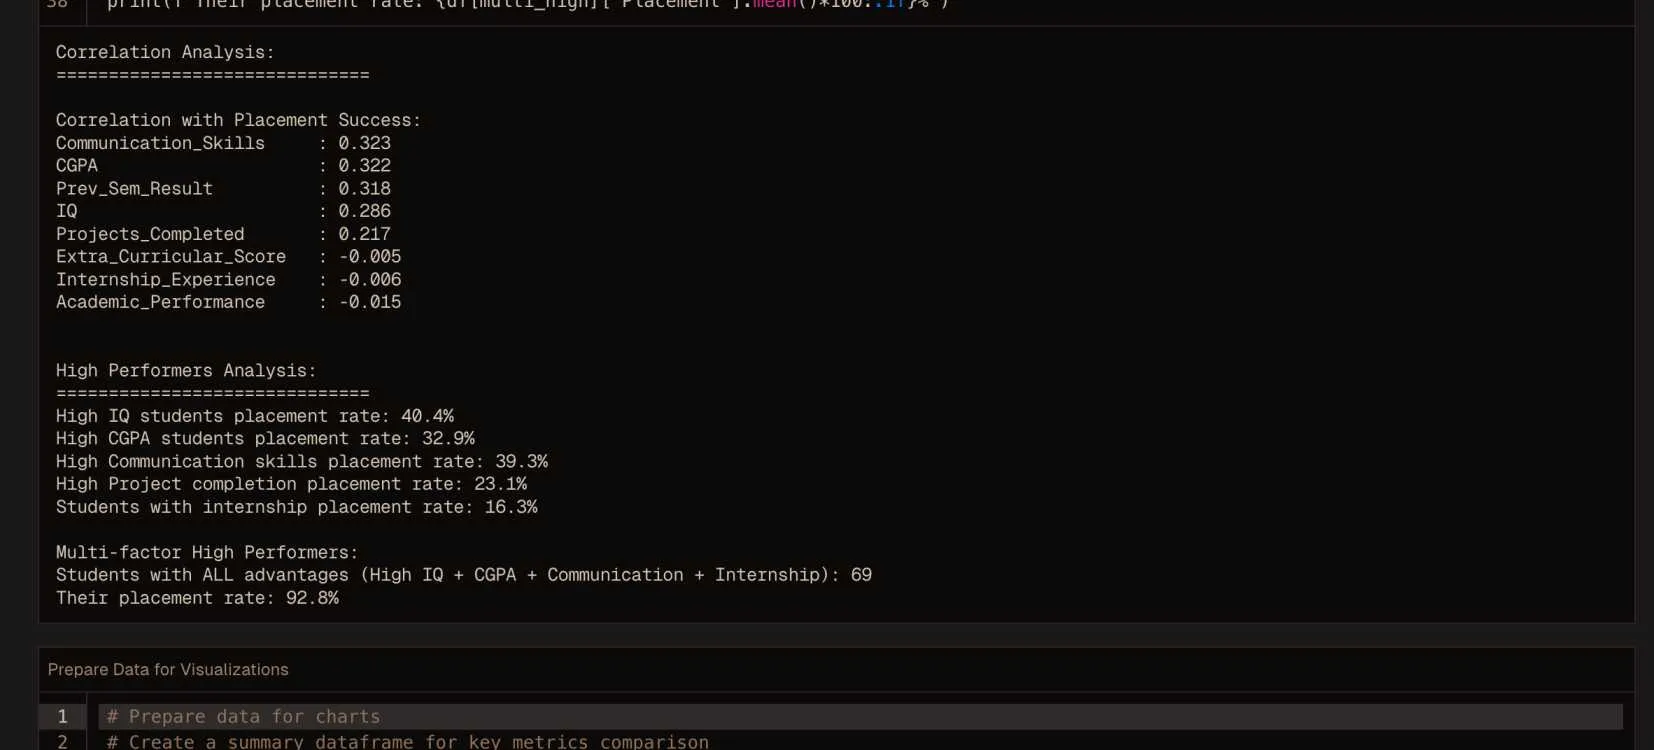
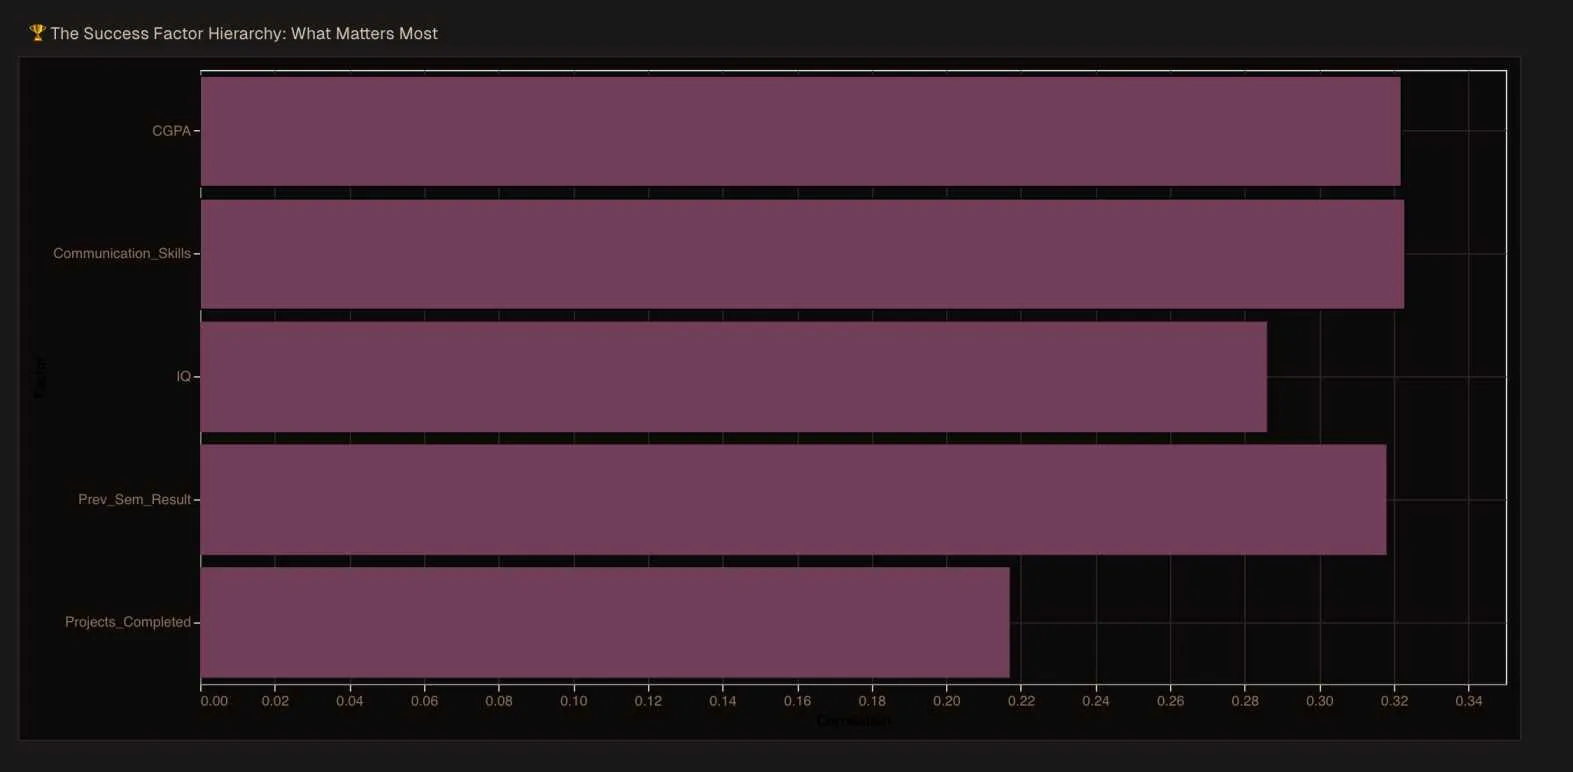
The platform ran the analysis and visualized the results. And here’s what jumped out immediately:
- Communication Skills: 0.323 correlation (the strongest predictor)
- Academic Performance: 0.265 correlation (important, but second place)
- Internship Experience: Significant positive impact
- IQ Score: Weaker than you’d think
Here’s the thing about correlation analysis that most people miss: it’s not just about finding relationships; it’s about prioritizing where to focus your efforts. The LiveDocs analysis made it crystal clear that if colleges want to improve placement rates, communication training should be priority number one.
—
Finding Your “Elite Group”
I started wondering: What if we look at students who excel in multiple areas? What’s their success rate?
In Excel, you’d be filtering and cross-referencing for hours. In LiveDocs, I just asked: “Show me students who have above-average communication skills, academic performance, and internship experience.”
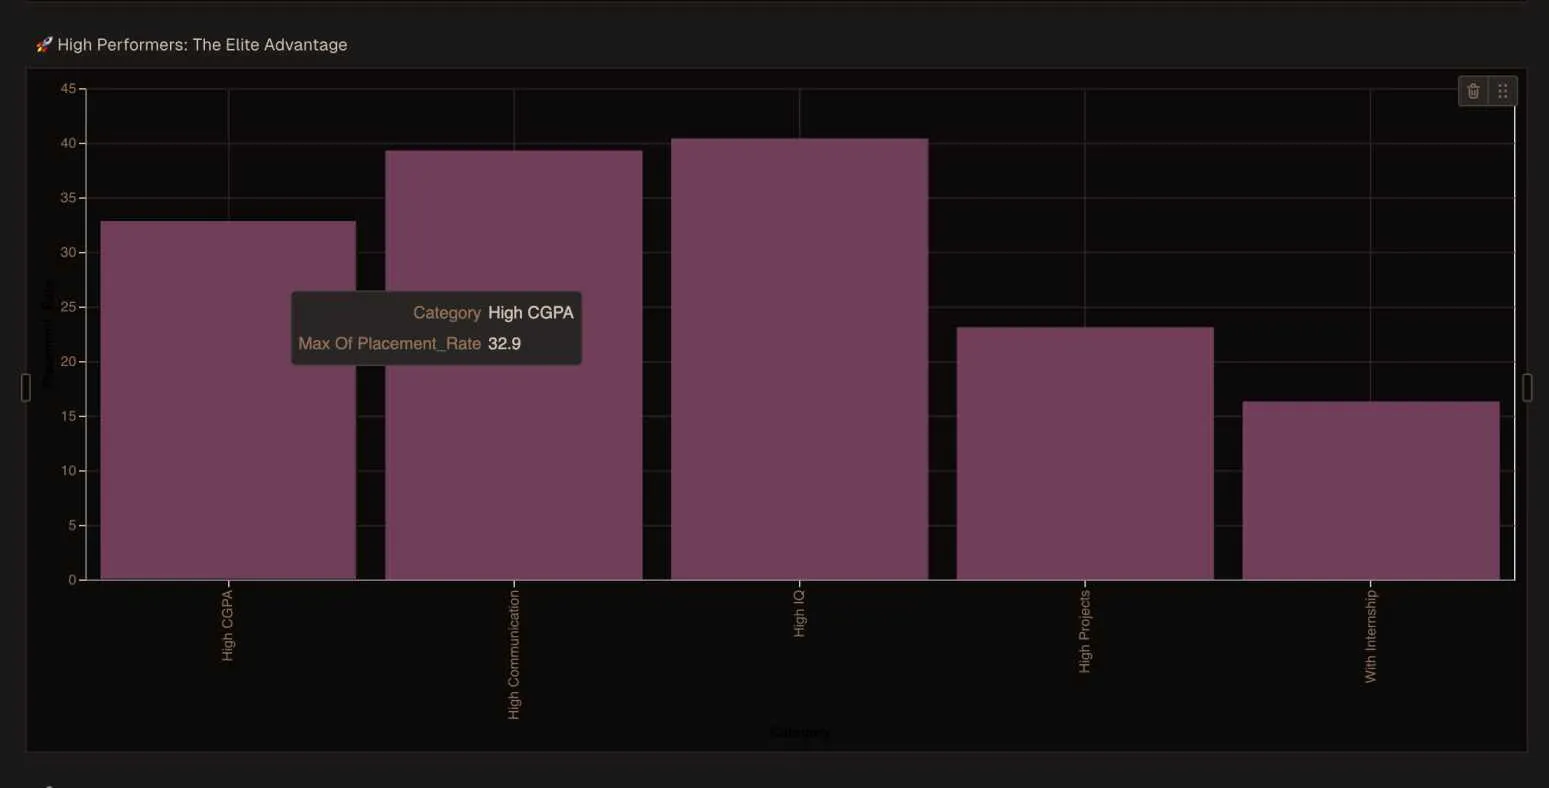
These are 69 students out of our 10,000 who excelled in multiple key areas simultaneously. Their placement rate? A staggering 92.8%.
Let that sink in. While the overall average hovers at a dismal 16.6%, these students achieved nearly six times that rate. They didn’t just succeed they crushed it.
What made them different? Here’s the thing: they weren’t necessarily smarter. They didn’t all have 4.0 GPAs or come from prestigious backgrounds. What they had was strategic development across multiple dimensions:
- Strong communication skills. They could articulate their thoughts clearly, whether in writing or conversation. They knew how to tell their story.
- Solid academic foundations. Notice I said “solid,” not “perfect.” They performed well enough to demonstrate competence, but they didn’t sacrifice everything else for that extra half-point on their GPA.
- Real-world experience. Internships, projects, anything that got them out of the classroom and into actual work environments.
- Emotional intelligence. They understood people, read situations, adapted their approach based on context.
The Elite prove something crucial: placement success isn’t about being naturally gifted or lucky. It’s about deliberately developing yourself in the areas that actually matter to employers.
—
Why Your Communication Skills Matter More Than Your Degree
Let’s get real for a minute. The job market has changed dramatically in the past decade, but college curriculums? Not so much. Most universities still operate on this assumption that if you master the technical knowledge in your field, jobs will just materialize. Economics majors learn economic theory. Engineering students learn engineering principles. Computer science folks learn to code.
All of that is important, obviously. But here’s what nobody tells you: employers hire people, not degrees.
Communication isn’t just some soft skill you can ignore. It’s the foundation of literally everything you’ll do in your career. You’ll need to:
- Interview (obviously)
- Negotiate your salary
- Collaborate with teammates
- Present your ideas to leadership
- Handle conflicts with colleagues
- Network with industry professionals
- Explain technical concepts to non-technical people
- Write emails, proposals, reports, and presentations
Miss on communication, and it doesn’t matter how brilliant you are. You’ll struggle to convince anyone to take a chance on you.
—
Replicating This Analysis: Your Turn
Look, I’ve walked you through exactly how I conducted this analysis using LiveDocs. Now let me give you a framework you can use for your own data, whatever it might be:
- Define your success metric: For me, it was placement (yes/no). For you, it might be sales conversions, customer retention, employee performance, student graduation rates whatever outcome you’re trying to improve.
- Upload your data to Livedocs: The platform handles most file formats and can connect to databases if you’re working with larger datasets.
- Start with descriptive statistics: What’s your baseline? What does your data actually look like? Don’t skip this step even though it seems basic.
- Run correlation analysis: Ask LiveDocs to identify which factors are most strongly related to your success metric. This tells you where to focus.
- Create comparison visualizations: Show the differences between your success group and everyone else. Make it visual. Make it obvious.
- Identify your high performers: Segment your data to find the elite group those who excel across multiple dimensions. Study what makes them different.
- Calculate impact: If you could move average performers toward high performer characteristics, what would the results be? Model it.
- Extract actionable insights: What do the findings actually mean for decisions you need to make? This is the whole point.
Compare that to doing it manually in traditional tools, which would’ve taken days and required actual statistical coding knowledge.
—
Final Thoughts
This investigation started with a concerning statistic and a simple question: Why do so many college students fail to land jobs?
We found our answer. Communication skills, practical experience, and holistic development matter far more than academic performance alone. The students who succeed understand this. The ones who struggle don’t or they figured it out too late.
But awareness is just the first step. Action is what actually changes outcomes.
If you’re a student, start today. Have a conversation that makes you uncomfortable. Sign up for that internship. Join a club. Give a presentation. Write something and share it publicly. Small actions compound over time.
If you’re an educator or administrator, look at your programs through the lens of actual employment outcomes. Are you preparing students for success, or are you preparing them for tests? There’s a difference, and the data makes it painfully clear.
The opportunity to fix this is sitting right in front of us. We know what works. We know what doesn’t. We have the data, the insights, and the roadmap.
What we need now is the will to actually do something about it. Because honestly? An 83.4% failure rate should bother all of us. These are smart, capable young people who did everything right according to the old playbook. They deserve better. And we can give it to them.
The time for action is now. The path is clear. And the future belongs to the students who understand that success isn’t just about what you know it’s about how well you can share it with the world.
You can access the notebook here.
The fastest way to build a live notebook in 2026? Livedocs.
- Instant data connections
- Drag-and-drop editor
- Real-time updates
- Easy sharing
Get started with Livedocs and build your first agentic notebook in minutes.
—
- 💬 If you have questions or feedback, please email directly at a[at]livedocs[dot]com
- 📣 Take Livedocs for a spin over at livedocs.com/start. Livedocs has a great free plan, with $10 per month of LLM usage on every plan
- 🤝 Say hello to the team on X and LinkedIn
Stay tuned for the next tutorial!
Ready to analyze your data?
Upload your CSV, spreadsheet, or connect to a database. Get charts, metrics, and clear explanations in minutes.
No signup required — start analyzing instantly

