Replace Analyst-Dependent Reporting
“Can you pull a report on Q3 pipeline conversion?”
Someone from marketing wants to know which campaigns drove the most qualified leads. The CFO needs expense breakdowns by department. Customer success wants churn analysis by cohort. And your analyst is drowning in Slack messages, email requests, and “quick questions” that each take two hours to answer.
Sound familiar?
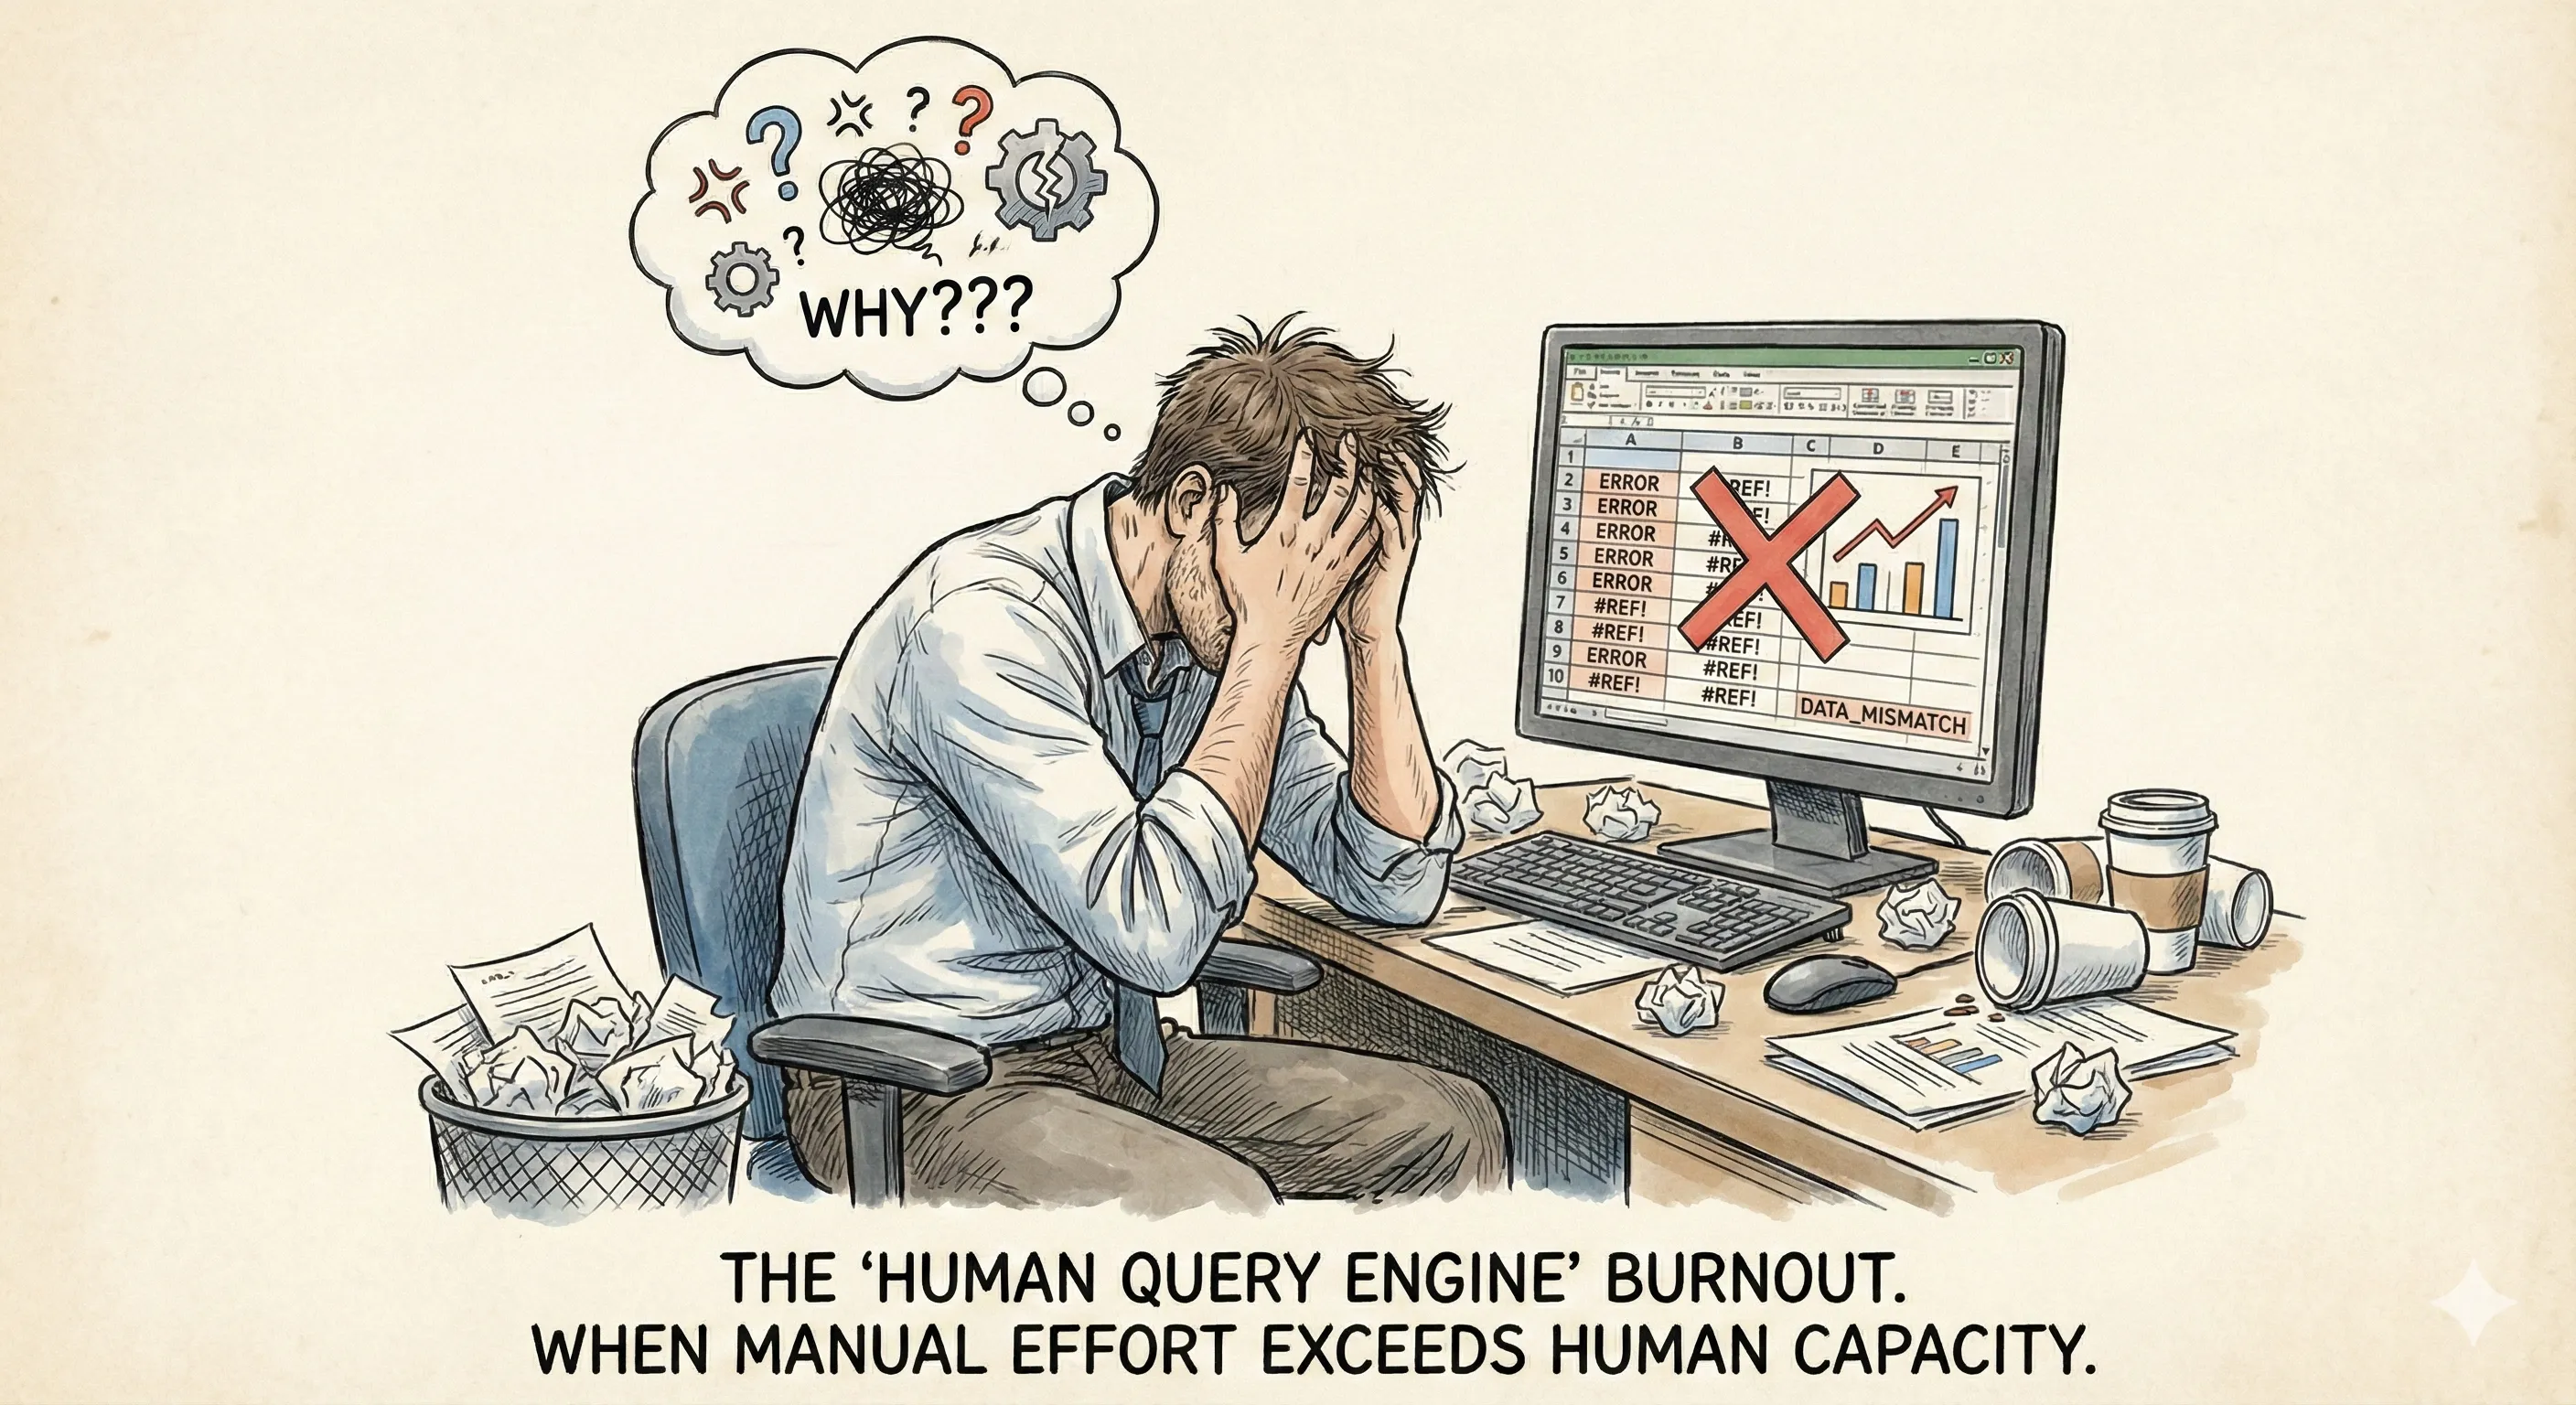
This is what analyst-dependent reporting looks like in most companies. Smart, capable people spending 70-80% of their time fulfilling data requests instead of actually analyzing anything. It’s inefficient, it’s frustrating, and honestly, it’s a waste of talent. Let’s talk about how this happened, why it’s unsustainable, and what you can actually do about it.
The Analyst Bottleneck
Here’s the thing, companies didn’t plan to make their analysts into human query machines. It just evolved.
You hire your first analyst. They’re excited. They build some dashboards, create reports, help teams understand their data. Everyone’s happy. Then more people realize the analyst can answer their questions. More requests come in. The analyst gets busier. The company grows. You hire another analyst. Then another.
But the requests grow faster than the headcount. Because once people know they can get data-driven answers, they want data-driven answers for everything. Which is actually good! Data-informed decision-making is exactly what you want.
The problem isn’t that people are asking questions. The problem is that answering those questions requires human intervention every single time.
A Day in the Life
Let me walk you through what a typical analyst’s day actually looks like. I’ve talked to dozens of them, and the pattern is remarkably consistent.
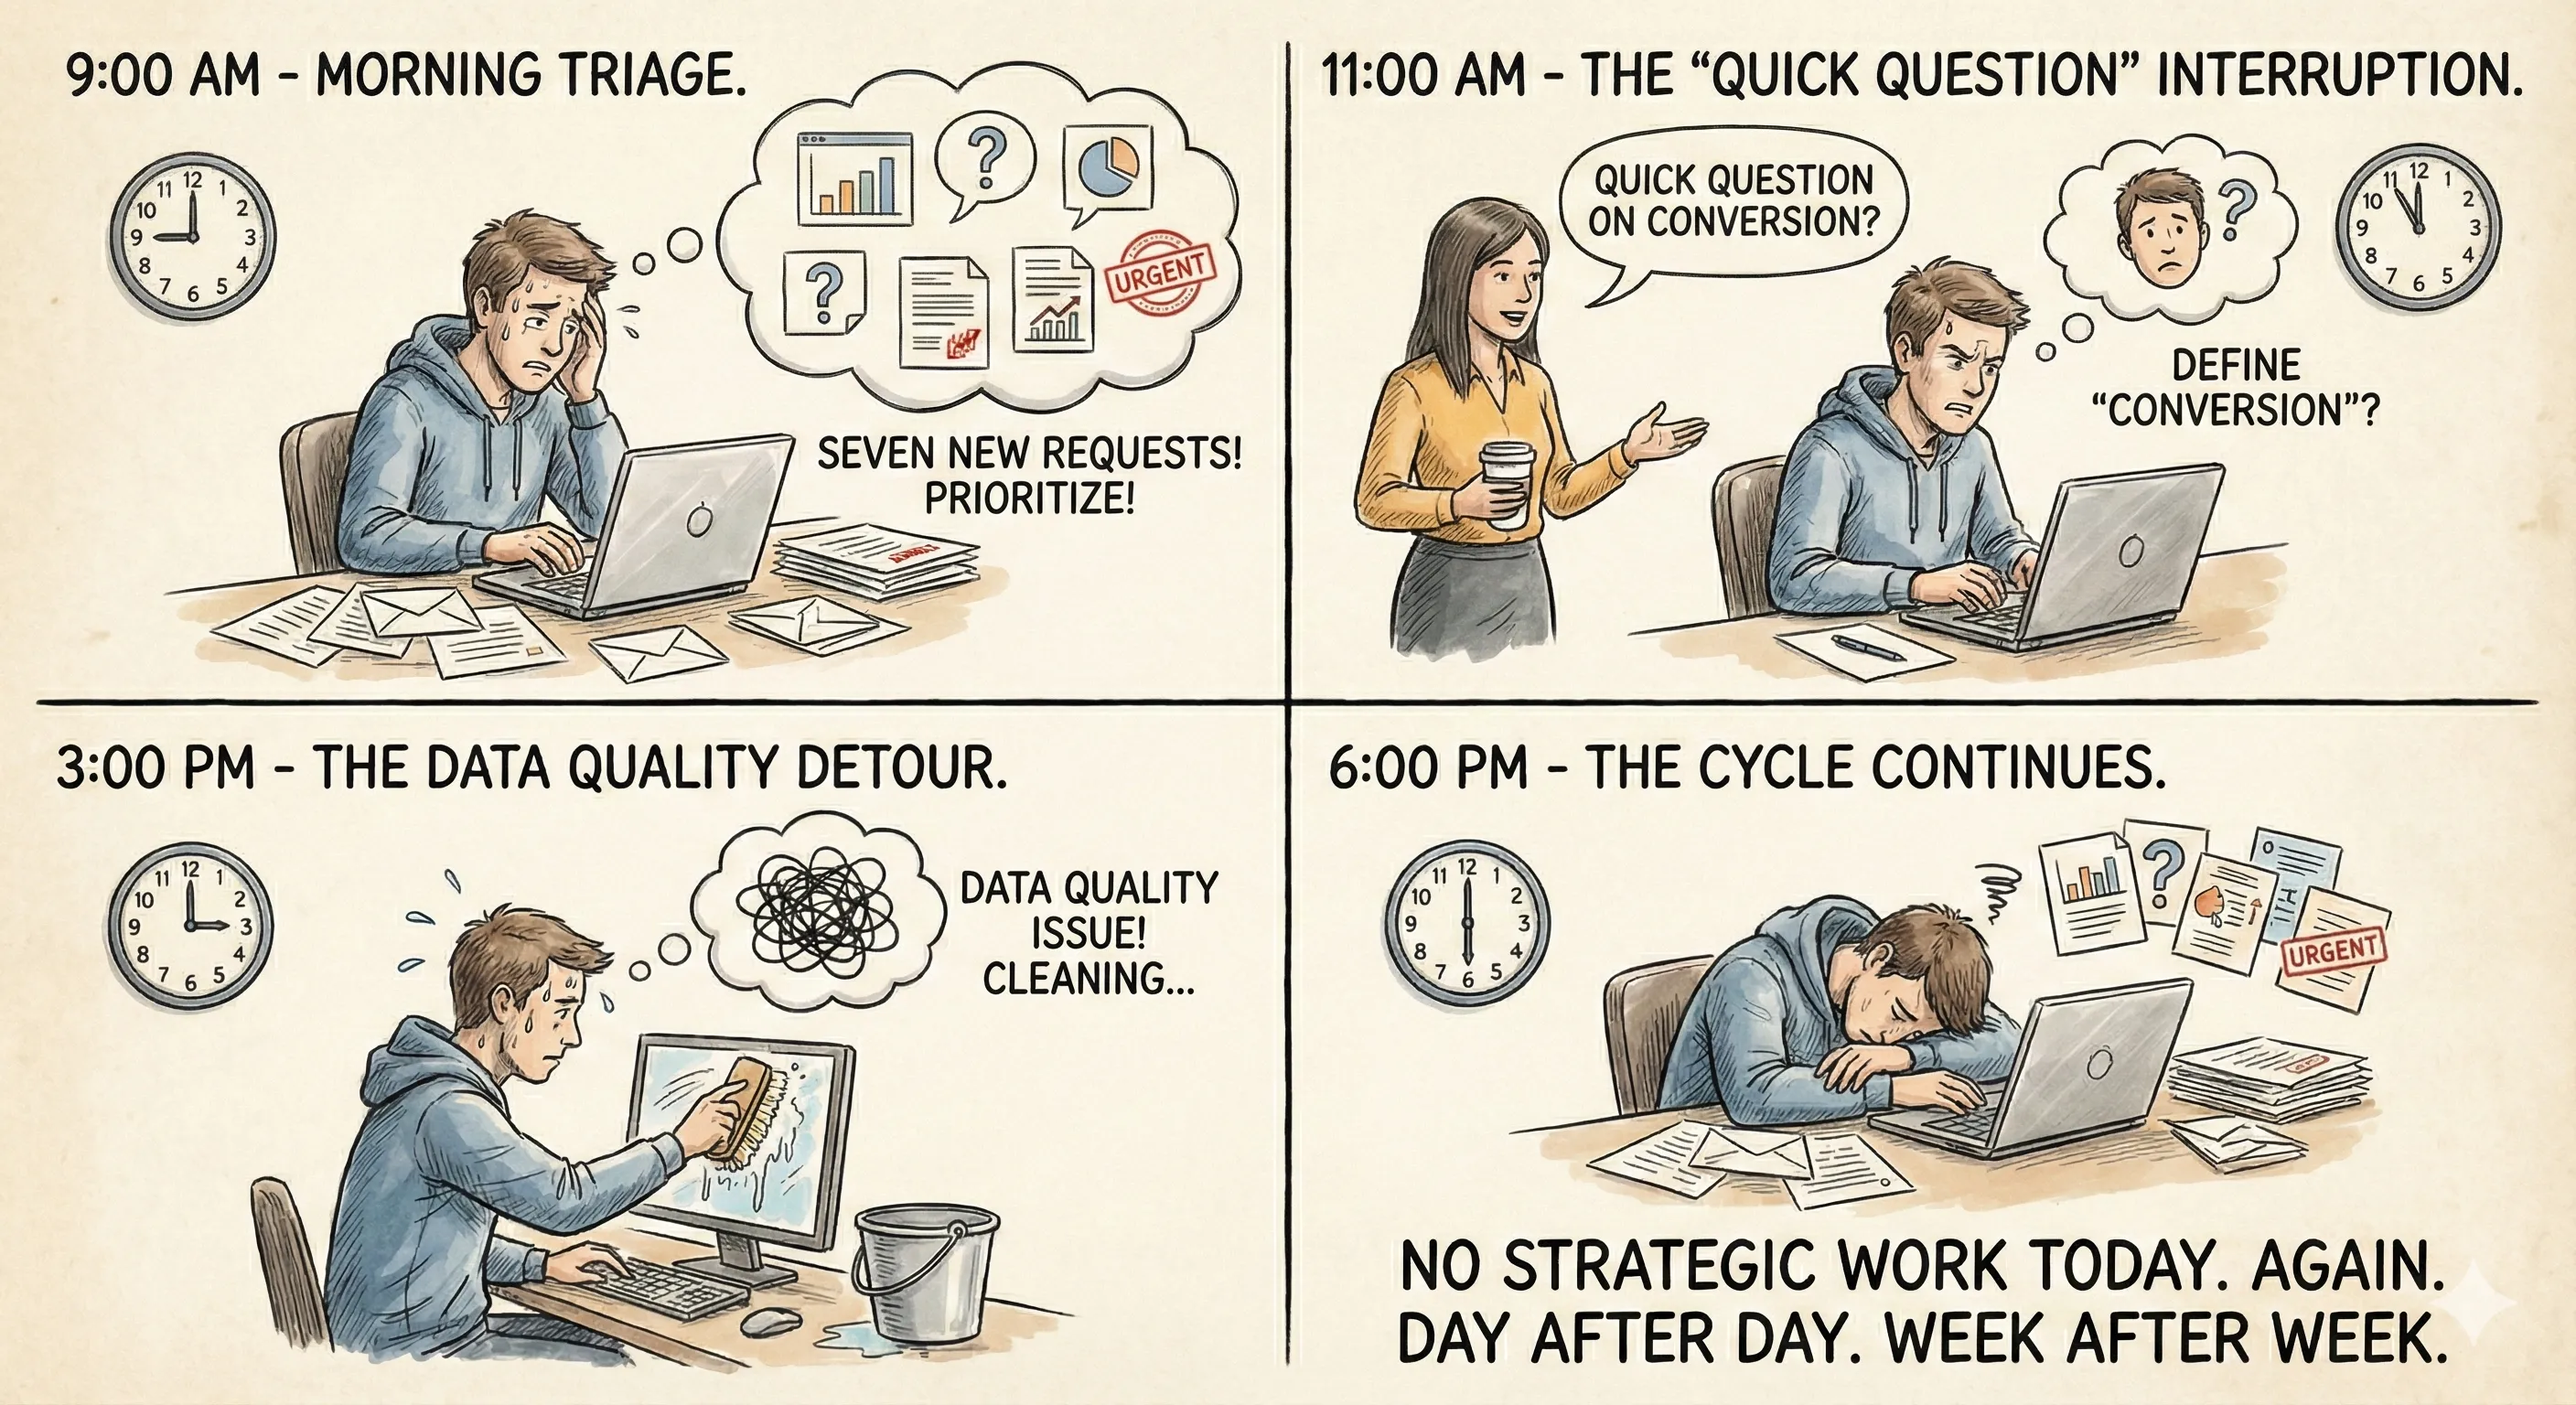
9:00 AM - Check messages. Seven new requests came in overnight and over the weekend. Prioritize which ones are actually urgent.
9:30 AM - Start working on yesterday’s request from sales leadership about why deal velocity slowed. Pull data from Salesforce. Export to CSV. Load into their analysis tool. Start segmenting by region, deal size, sales rep, product line.
11:00 AM - Get interrupted by “quick question” from marketing. They need conversion rates by channel for last month. Drop current work. Pull that data. Realize their definition of “conversion” isn’t clearly defined. Spend 20 minutes clarifying what they actually need.
12:00 PM - Lunch, except not really because they’re still thinking about that sales velocity question.
1:00 PM - Back to the sales analysis. Build some visualizations. Notice something weird in the data. Investigate. Turns out there’s a data quality issue. Spend an hour cleaning it up.
3:00 PM - Finally finish the sales analysis. Write up findings. Send report. Immediately get follow-up questions that require additional analysis.
4:00 PM - Three more requests came in during the afternoon. Triage them. Start working on the most urgent one. Realize it’s 6:00 PM and they haven’t done any strategic work today. Again. This is the cycle. Day after day. Week after week.
What Actually Gets Sacrificed
When your analysts are stuck in request-fulfillment mode, here’s what doesn’t happen:
They’re not proactively identifying trends. They’re not building predictive models. They’re not doing deep-dive analyses that might reveal strategic opportunities. They’re not improving your data infrastructure. They’re not mentoring other team members on data literacy. All the high-value work that analysts should be doing? It gets pushed aside because there’s always another urgent request in the queue.
And the requests never stop. Because every answer leads to another question. Every report generates follow-up analysis. It’s an infinite loop of reactive work.
They’re not improving your data infrastructure. They’re not mentoring other team members on data literacy.
The Standard “Solutions” That Don’t Actually Work
Most companies try a few things when they realize their analysts are overloaded. Let’s talk about why none of them really solve the problem.
Solution 1: Hire More Analysts
This is the obvious answer. Too many requests? Add more people. Except this doesn’t scale linearly.
First, good analysts are expensive and hard to find. Second, as your company grows, requests grow faster than you can hire. Third, adding people adds communication overhead, now analysts need to coordinate on methodology, data definitions, tool choices.
I’ve seen companies go from one analyst to a team of eight and still have the same bottleneck problem. Just distributed across more people.
Solution 2: Build More Self-Service Dashboards
Another common approach. Create dashboards so people can answer their own questions without bothering analysts. This works for about 10% of questions.
The problem is that most business questions aren’t simple dashboard lookups. They require segmentation, filtering, custom calculations, or comparing metrics that don’t live in the same dashboard. So people still come to analysts.
Plus, building and maintaining comprehensive dashboards is itself analyst work. You’re just shifting the bottleneck from answering ad-hoc questions to building self-service tools.
Solution 3: Implement a Ticketing System
Some companies formalize the chaos with ticketing systems. Requests go into a queue, get prioritized, tracked, assigned. It’s more organized, which is marginally better.
But it doesn’t make the work itself any faster. Analysts still have to manually fulfill every request. You’ve just added process overhead to make the backlog more visible.
Actually, sometimes this makes things worse because now everyone can see exactly how long requests are taking, which creates pressure to rush through analyses.
What Analysts Actually Do (And What Can Be Automated)
Let’s break down the typical analyst workflow when someone asks a question. Understanding this is key to figuring out what can actually be replaced.
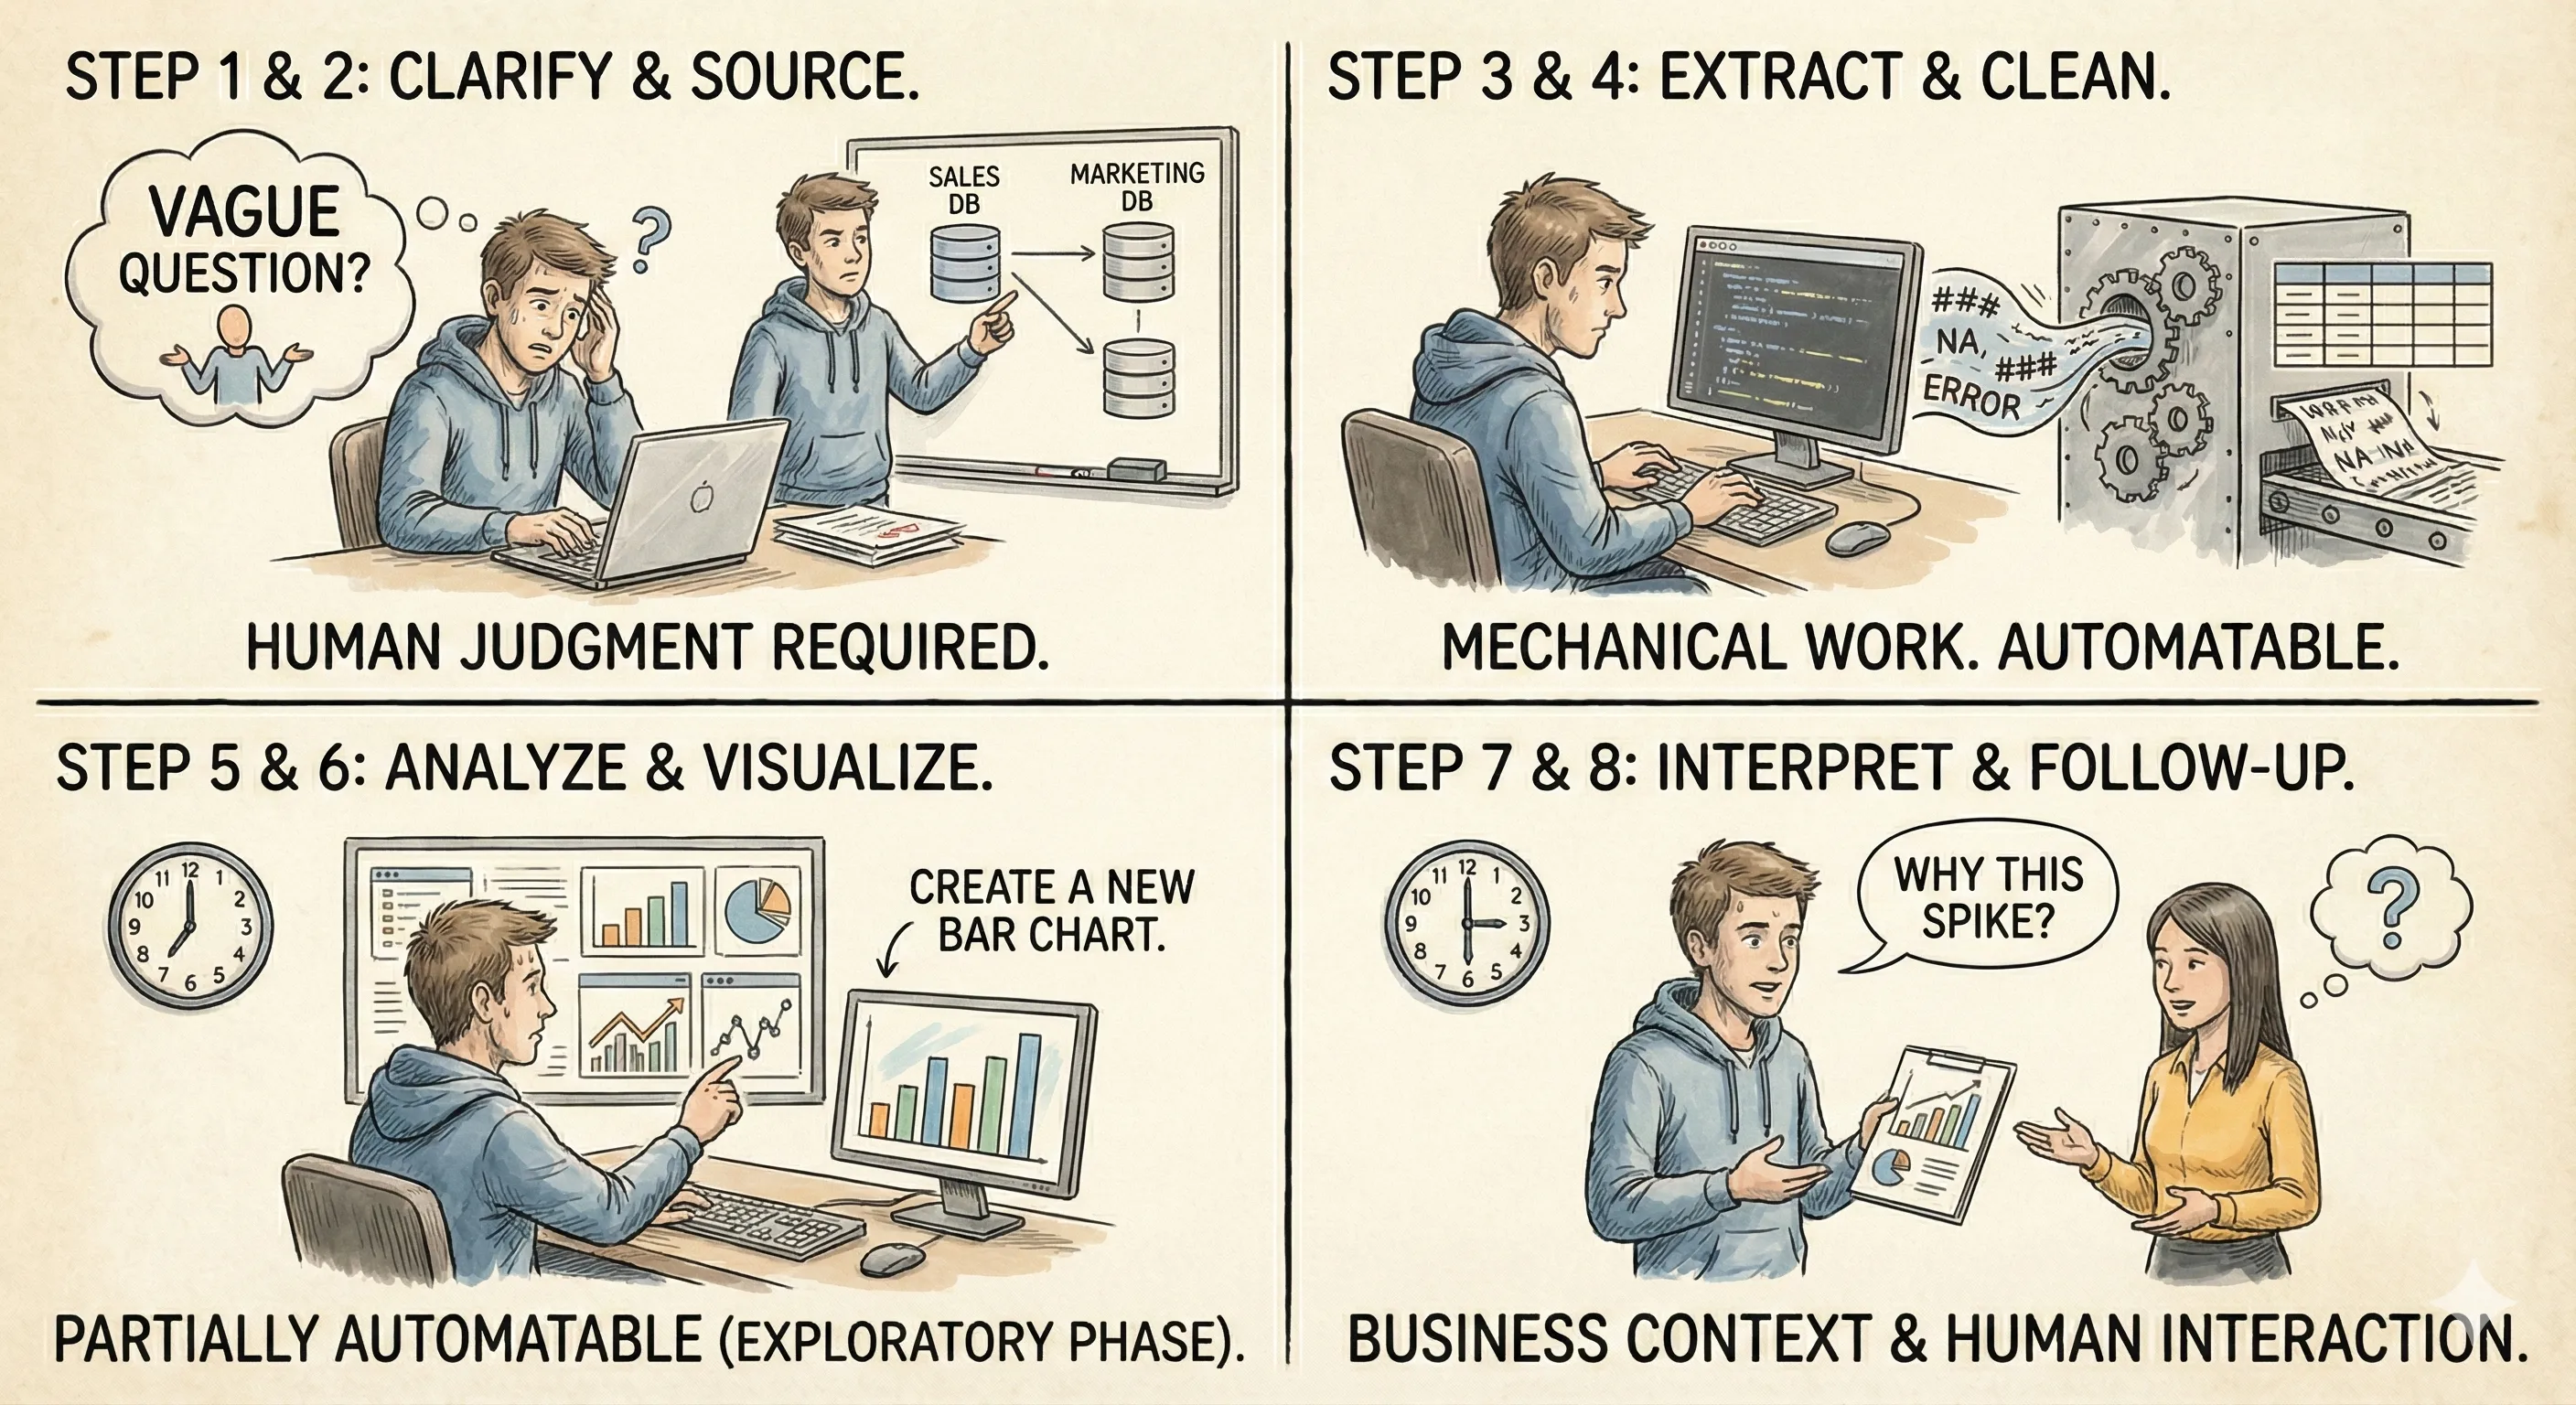
Step 1: Clarify the Question
Someone asks something vague. The analyst spends time understanding what they actually need. This requires human judgment, can’t automate this.
Step 2: Determine Data Sources
Figure out which databases, tools, or systems contain the relevant data. This is institutional knowledge. Hard to automate without context.
Step 3: Extract the Data
Write SQL queries or use BI tools to pull the data. This is mechanical work. Definitely automatable.
Step 4: Clean and Transform the Data
Deal with missing values, outliers, inconsistent formats. Combine data from multiple sources. Mechanical and tedious. Automatable.
Step 5: Analyze the Data
Segment it different ways. Calculate metrics. Look for patterns. Run statistical tests. This is where the actual analysis happens. Parts of this can be automated, especially the exploratory phase.
Step 6: Create Visualizations
Build charts and graphs that make the findings clear. Partially automatable—the chart creation is mechanical, but choosing the right visualization requires judgment.
Step 7: Interpret and Document Findings
Explain what the data means, what’s significant, what actions to take. This requires business context and human judgment. Can’t fully automate.
Step 8: Handle Follow-Up Questions
After sharing results, answer clarifying questions, dig deeper into specific areas. Requires human interaction.
Here’s the key insight: Steps 3, 4, and 5 eat up about 70% of an analyst’s time on any given request. And those are exactly the steps that modern AI can handle automatically. You’re not replacing the analyst. You’re replacing the mechanical investigation work that prevents them from doing actual analysis.
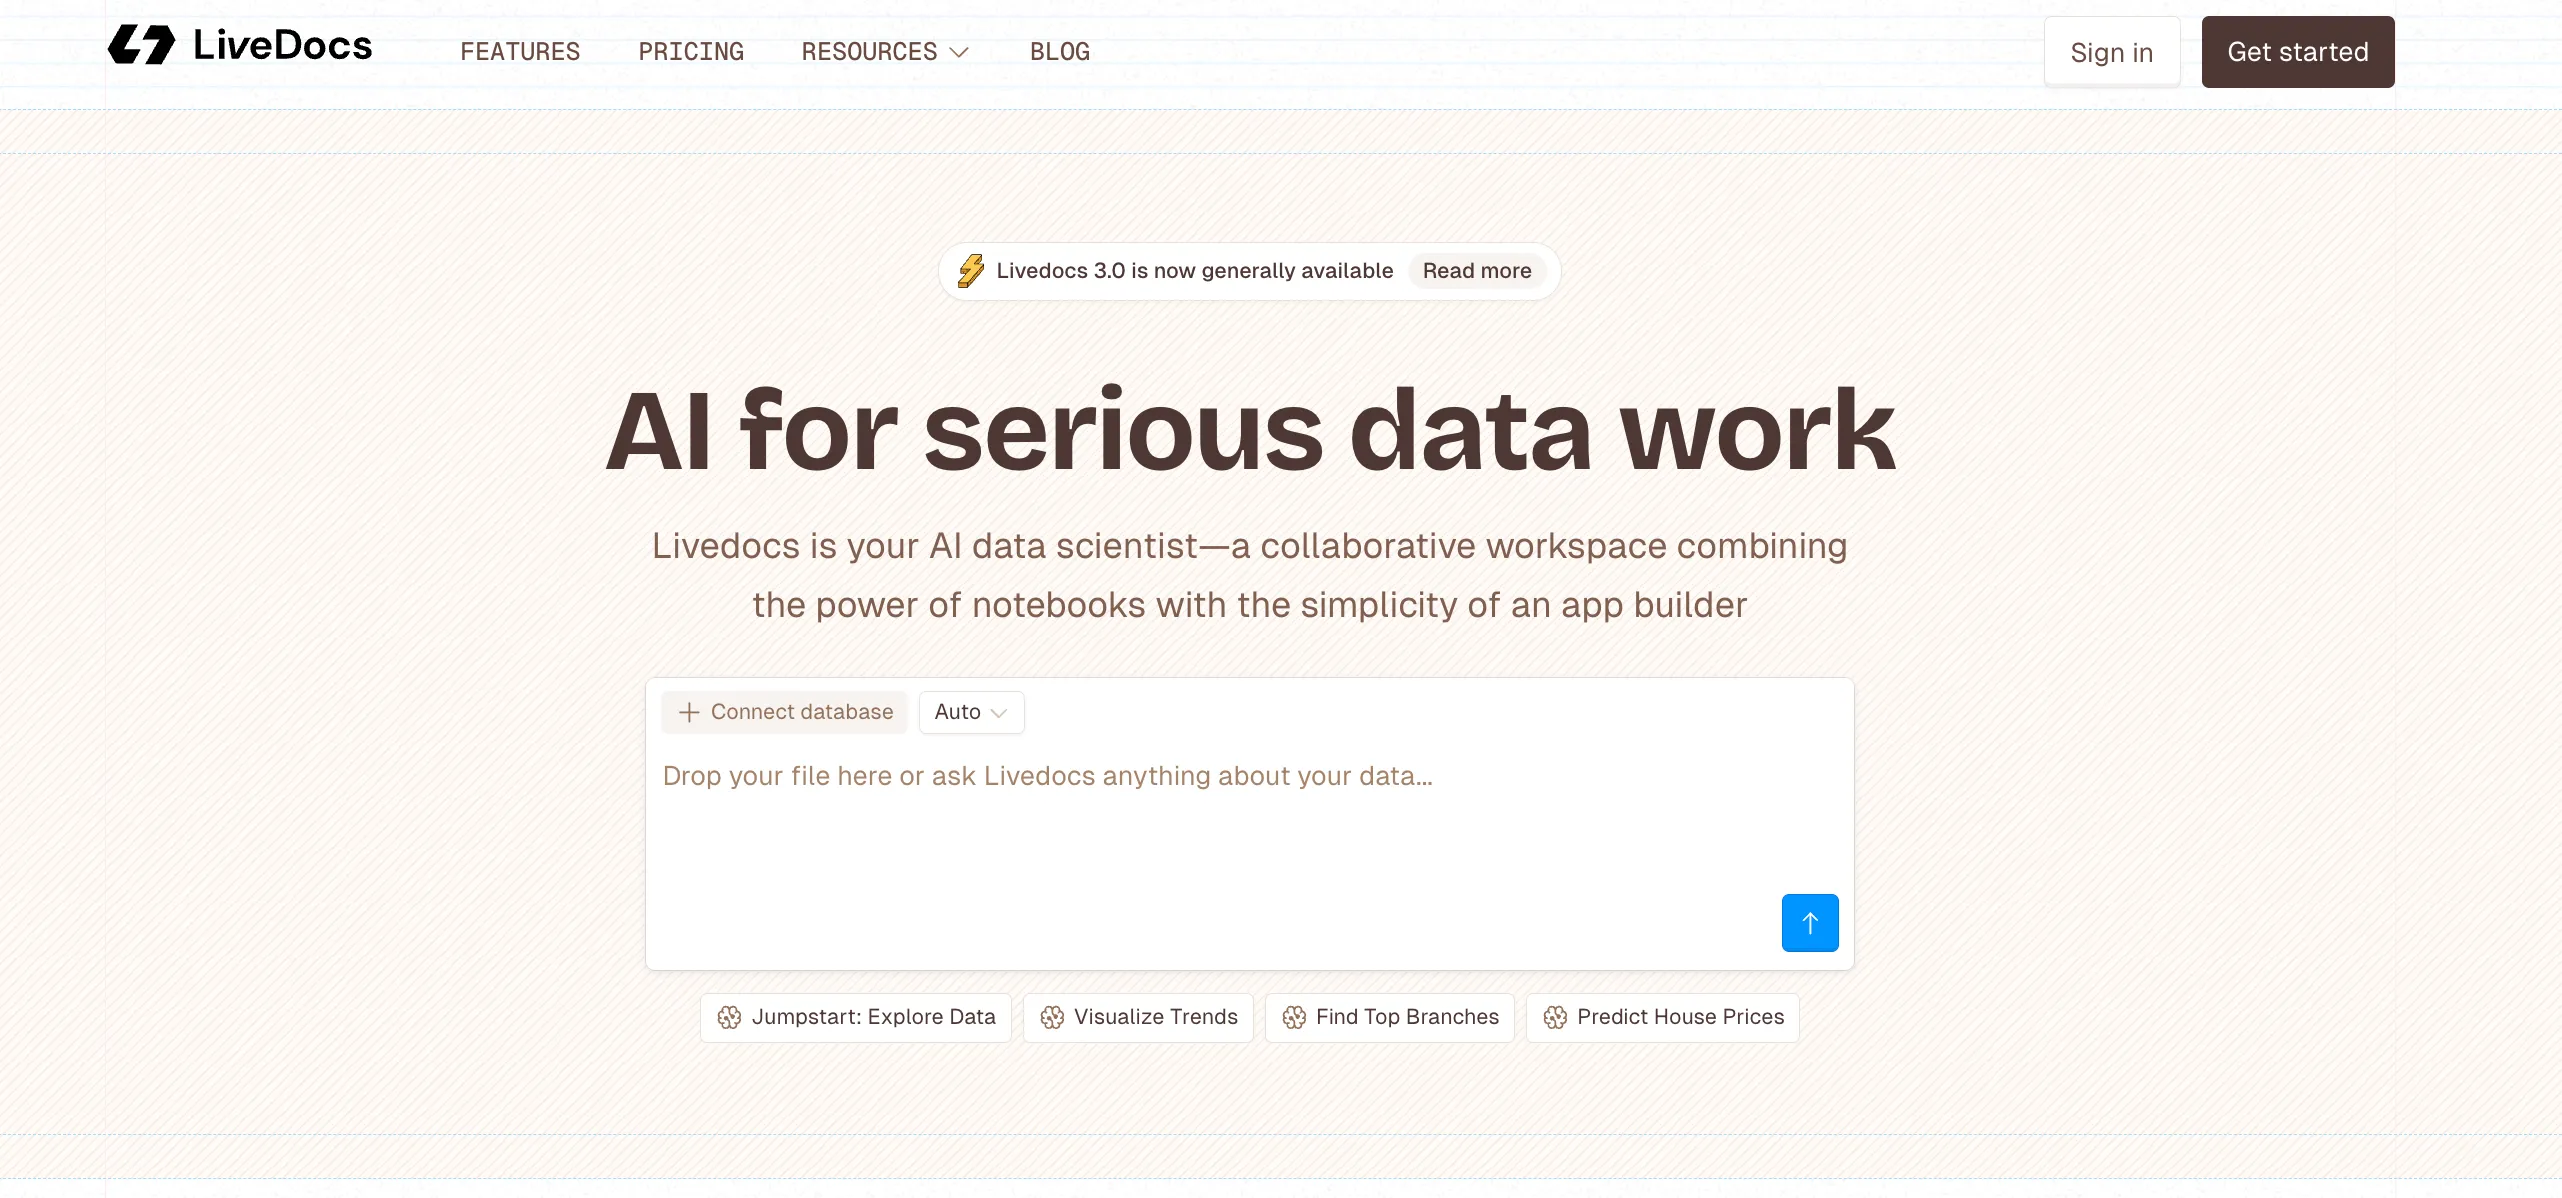
Enter Livedocs: Automation That Actually Makes Sense
This is where things get interesting. Livedocs isn’t trying to replace your analysts, it’s trying to give them their time back.
The platform continuously monitors your key business metrics and automatically performs the investigative analysis that analysts normally do manually. When something changes, it doesn’t wait for someone to ask about it. It immediately investigates why.
Think about the most common requests analysts get:
- “Why did [metric] change last week?”
- “What’s driving the difference between this quarter and last?”
- “Which customer segments are performing best/worst?”
- “Can you break down [metric] by [dimension]?”
Livedocs answers these questions automatically. Not because someone asked, but because the system is continuously analyzing your data and identifying meaningful changes.
Real Examples of What Gets Automated
Let me give you concrete scenarios of analyst work that Livedocs handles automatically.
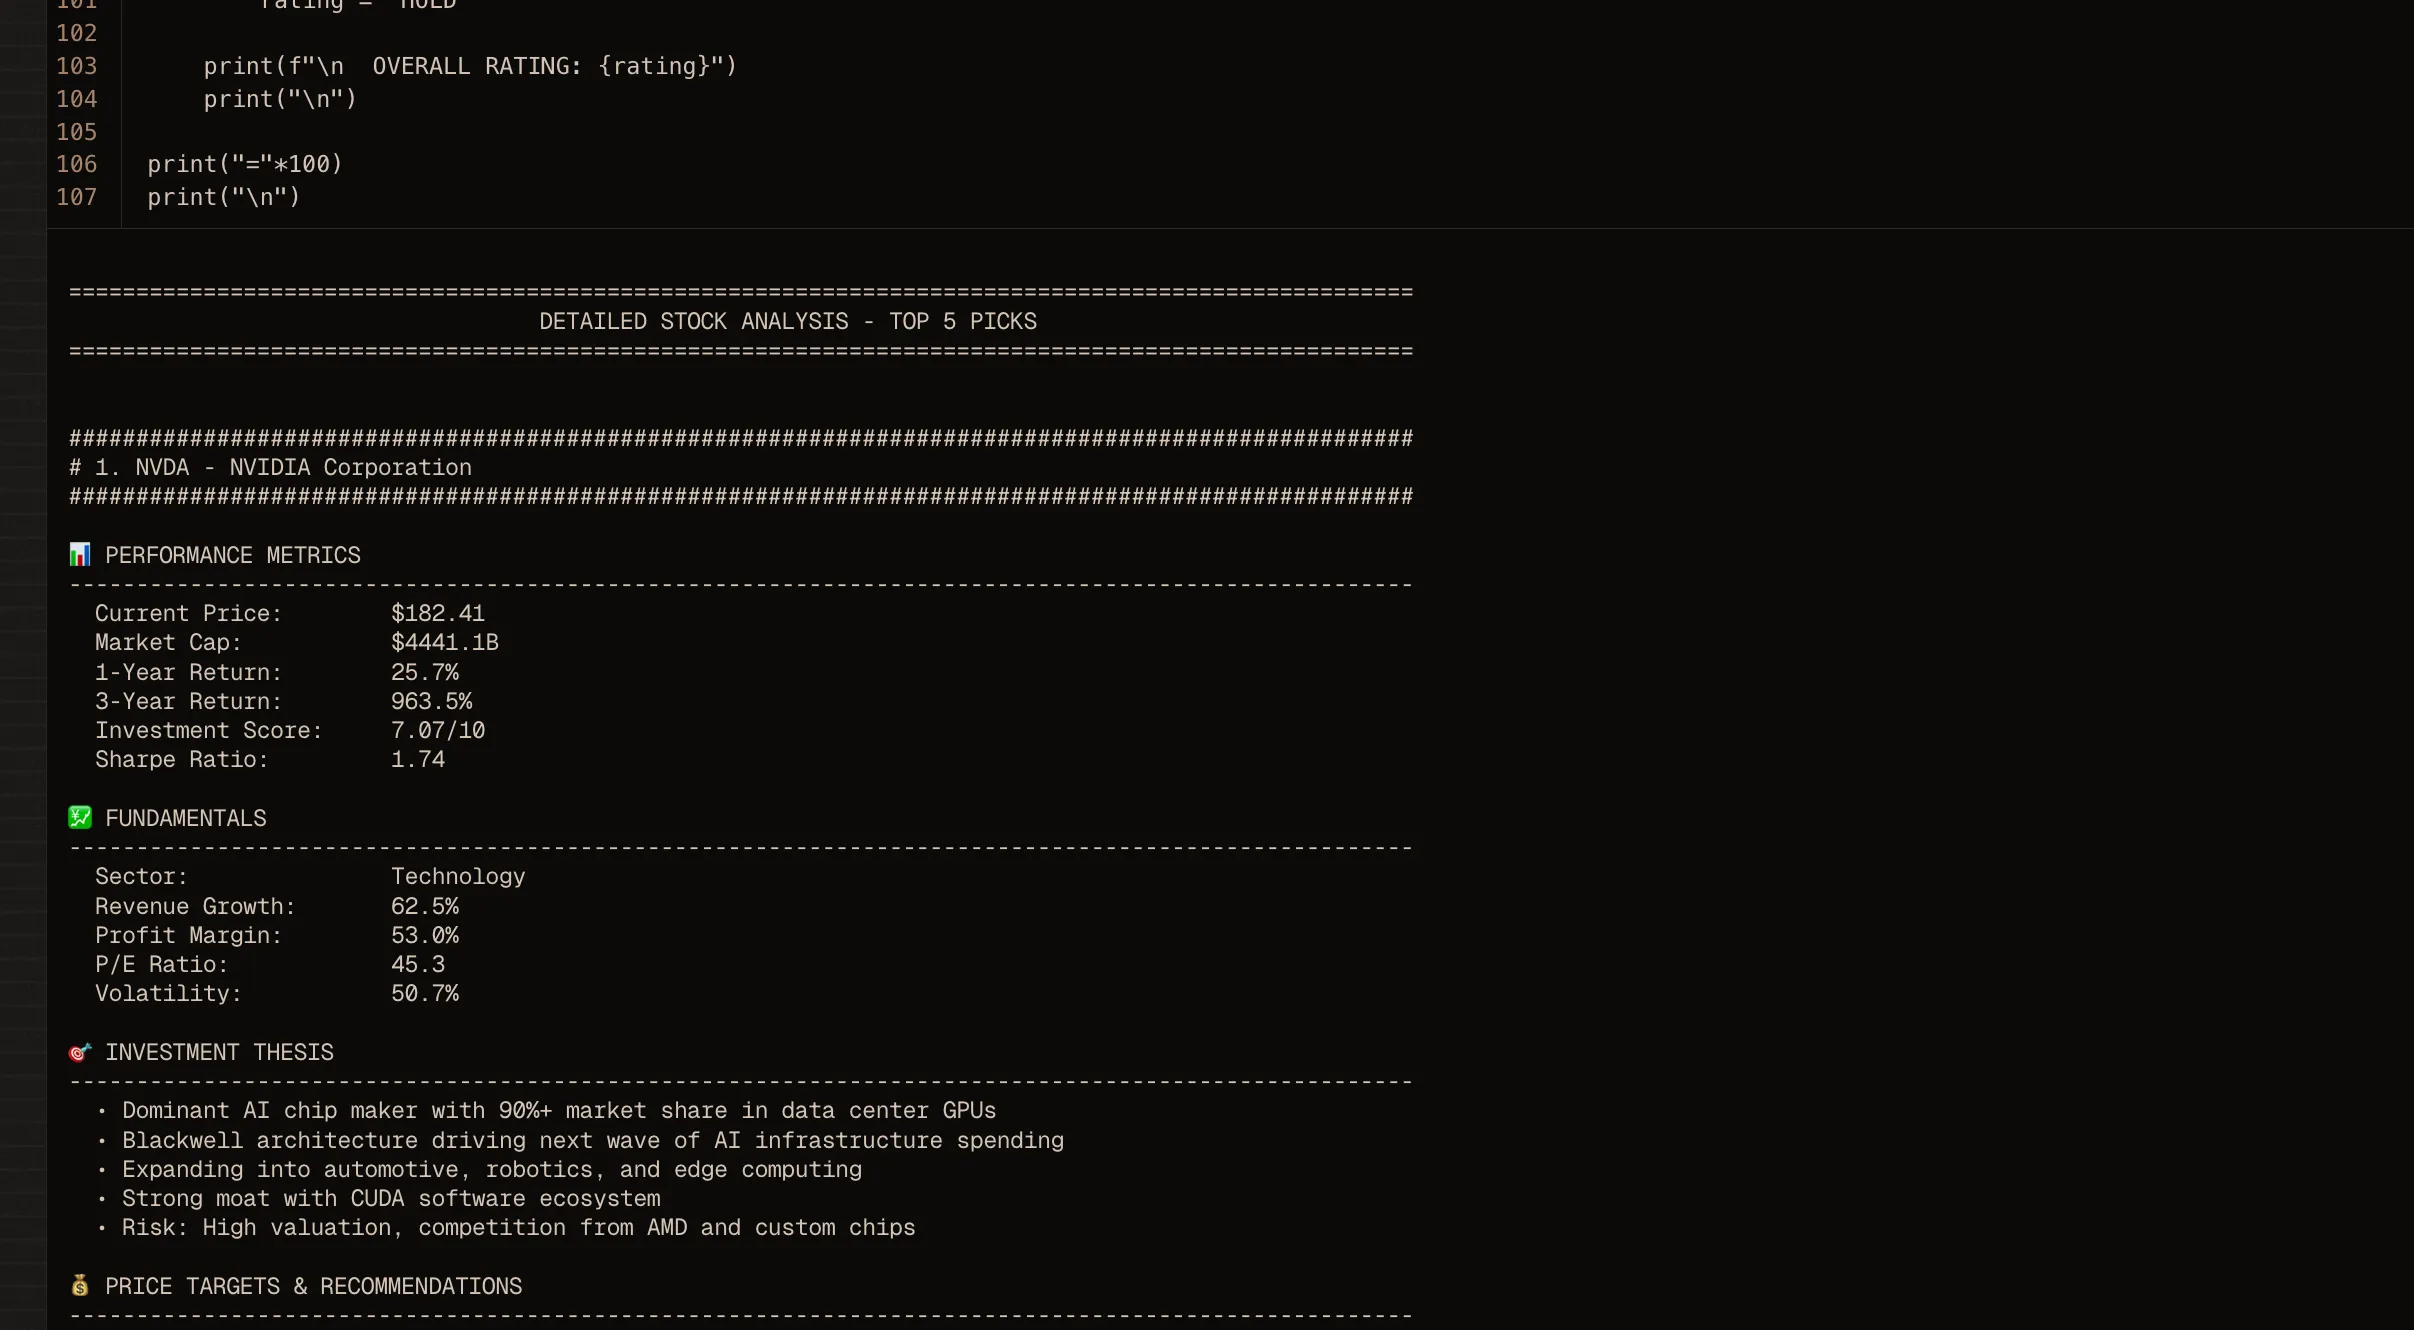
Scenario 1: Revenue Variance Analysis
Traditional Process: Sales VP asks, “Why did we miss forecast by $200K last month?” Analyst spends half a day pulling data from Salesforce, segmenting by region, product, deal size, and sales rep. Builds pivot tables. Identifies that most of the variance came from enterprise deals in the Northeast slipping to next quarter. Creates a report.
Total time: 4-6 hours.
With Livedocs: The system detected the revenue miss automatically and already ran the analysis. It shows: “Revenue was $200K below forecast, driven primarily by three enterprise deals ($180K total) in Northeast territory slipping from November to December close dates, plus lower-than-expected new customer acquisition in SMB segment ($50K), partially offset by higher expansion revenue from existing customers ($30K).” Available immediately when someone asks.
Total time: 30 seconds to retrieve.
Scenario 2: Churn Analysis
Traditional Process: Customer Success asks, “Our churn rate increased, what’s causing it?” Analyst extracts churn data, segments by customer size, industry, tenure, product usage, engagement level. Looks for patterns. Runs statistical tests to see what’s significant. Builds visualizations. Documents findings.
Total time: 3-4 hours.
With Livedocs: System continuously monitors churn and automatically segments across all relevant dimensions. When churn increases, it identifies that the spike is concentrated in customers who’ve been with the company 6-9 months, specifically those with low product engagement (less than 3 logins per week) and no integration with other tools. The analysis is already done when the question gets asked.
Total time: Immediate.
Scenario 3: Marketing Channel Performance
Traditional Process: Marketing team wants to know which channels are delivering the best ROI. Analyst pulls data from Google Analytics, paid ad platforms, CRM. Calculates cost per lead, cost per customer, LTV by channel. Segments by campaign type. Compares time periods. Creates dashboards.
Total time: 5-6 hours spread over multiple days.
With Livedocs: Platform tracks marketing metrics continuously and identifies that LinkedIn ads are generating leads at 40% higher cost than last quarter, but those leads convert to customers at 2x the rate, resulting in better overall ROI despite higher acquisition costs. Meanwhile, Google ads show declining performance with both higher costs and lower conversion. Analysis is ready whenever someone needs it.
Total time: Instant access.
Scenario 4: Product Feature Usage
Traditional Process: Product team asks, “Which features correlate with retention?” Analyst pulls product analytics data, identifies cohorts based on feature usage, calculates retention rates for each cohort, runs correlation analysis, controls for confounding variables. Visualizes findings.
Total time: 4-5 hours.
With Livedocs: System analyzes usage patterns automatically and surfaces that customers who enable automation features within their first 30 days have 3.5x higher retention at 12 months. It also identifies that customers who integrate with Slack retain at 2.8x the rate of those who don’t. The insight exists before anyone asks for it.
Total time: Available immediately.
The Pattern You Should Notice
See what’s happening here? The mechanical parts, data extraction, segmentation, statistical analysis, pattern identification, are all automated. The analyst’s time gets freed up for the parts that actually require human intelligence:
- Deciding what metrics matter to the business
- Determining what actions to take based on insights
- Communicating findings to stakeholders who need context
- Doing strategic deep-dives that require business judgment
- Building models for specific business problems
This is the work analysts actually want to do. The work they were hired to do. The work that creates real value.
How This Changes Your Organization
Let’s talk about what actually shifts when you implement automated analysis instead of relying on analyst-dependent reporting.
For the Analysts Themselves
First, morale improves dramatically. I cannot overstate this. Analysts didn’t go into data work to be human query engines. They want to solve interesting problems, uncover insights, drive strategy.
When you remove the request-fulfillment burden, you give them back the work they find meaningful. They go from reactive to proactive. From executing other people’s queries to identifying opportunities nobody asked about yet.
One analyst I talked to said implementing Livedocs was like “getting my job back.” She went from spending 80% of her time answering ad-hoc questions to spending 80% of her time on strategic projects.
For the Business Teams
Teams that were waiting days for analysis now get instant answers. But more importantly, they get answers to questions they didn’t know to ask.
Because Livedocs is continuously monitoring and analyzing, it surfaces insights proactively. Marketing learns about channel performance changes before they waste budget. Sales sees pipeline trends before they miss forecast. Customer success identifies at-risk cohorts before churn spikes.
The shift from reactive to proactive analysis is subtle but powerful. You’re not just faster, you’re earlier.
For Leadership
Leadership gets better information for decisions because comprehensive analysis is available for every question, not just the ones important enough to justify analyst time.
Before, there was an implicit prioritization: important questions got thorough analysis, routine questions got quick-and-dirty answers or gut decisions. Now everything gets the same level of rigorous analysis because it’s automated.
This means better decisions across the board, not just on the big strategic questions.
The Implementation Reality
Okay, so how does this actually work in practice? Because I know what you’re thinking, this sounds great in theory, but implementation is probably a nightmare.
It’s not.
Livedocs connects to your existing data infrastructure. Your data warehouse, your CRM, your product analytics tools, wherever your business data lives. Standard integrations, nothing exotic.
You define the metrics that matter to your business, revenue, conversion rate, churn, whatever you currently track. The system starts monitoring those metrics and analyzing changes automatically.
Initial setup usually takes a few hours. You’re not rebuilding your data stack. You’re adding an intelligence layer on top of what already exists.
What About Data Quality?
This is always the concern. “Our data isn’t clean enough for automated analysis.” And honestly? Your data probably does have issues. Everyone’s does.
But here’s the thing, those data quality issues exist whether you’re doing manual analysis or automated analysis. The difference is that automated analysis is consistent. It applies the same logic every time. Manual analysis varies depending on who’s doing it and how much time they have.
Plus, automated systems actually help you identify data quality problems faster because they’re looking at your data constantly, not just when someone requests a specific analysis.
The Analyst’s New Role
Let’s address the elephant in the room: if Livedocs is handling most investigative work, what do analysts do?
Everything they should have been doing all along:
Strategic Analysis: Deep dives into complex business questions that require multi-faceted investigation and business judgment.
Model Building: Creating predictive models, forecasting, scenario analysis, work that requires statistical expertise and business context.
Data Strategy: Improving data collection, defining metrics, building data literacy across the organization.
Insight Communication: Taking complex findings and making them accessible to different stakeholders.
Tool Optimization: Configuring Livedocs to track the right metrics, setting alert thresholds, refining analysis parameters.
Special Projects: All those interesting analyses that never got done because there was never time.
This is higher-value work. More interesting work. Work that actually leverages an analyst’s skills and expertise instead of just their ability to write SQL queries.
Measuring the Impact
How do you know if replacing analyst-dependent reporting is actually working? Here are the metrics that matter:
Time to Insight: How long from question to answer? Should drop from hours/days to minutes.
Analyst Utilization: What percentage of analyst time goes to ad-hoc requests versus strategic work? Should flip from 70/30 reactive to 30/70 proactive.
Question Volume: Number of questions getting answered. Should increase because answers are instant.
Decision Speed: How quickly can teams act on insights? Should accelerate significantly.
Problem Detection: How early are issues caught? Should see problems identified days or weeks earlier.
But honestly, the most telling metric is subjective: ask your analysts if they’re happier. If they’re doing more meaningful work. If they feel like they’re adding value beyond just pulling data.
If the answer is yes, you’ve succeeded.
What This Isn’t
Let me be clear about what replacing analyst-dependent reporting doesn’t mean.
-
It doesn’t mean firing your analysts. That would be stupid. Good analysts are valuable precisely because they understand your business and can apply judgment to complex problems.
-
It doesn’t mean eliminating all manual analysis. Some questions require custom investigation that automated systems can’t handle. That’s fine. Those should be the questions your analysts focus on.
-
It doesn’t mean perfect automation on day one. You’ll still need to configure the system, refine what gets monitored, adjust sensitivity levels. It’s a tool, not magic.
And it doesn’t mean analysts become obsolete. It means they finally get to do the job they were hired to do instead of being human query engines.
Making the Shift
So how do you actually transition from analyst-dependent reporting to automated analysis?
Start by tracking what questions your analysts are currently answering. Keep a log for a week. You’ll probably find that 60-70% of requests fall into predictable categories: metric changes, comparative analysis, segment breakdowns, trend identification.
Those are exactly the questions automated analysis handles well. Implement Livedocs to monitor those core metrics and answer those routine questions automatically.
Your analysts’ role shifts from answering every question to configuring the system to answer questions automatically, then handling the complex edge cases that require human judgment.
Over time, you’ll identify more patterns, automate more analyses, and free up more analyst time for strategic work.
The Three-Month Transformation
Here’s what typically happens:
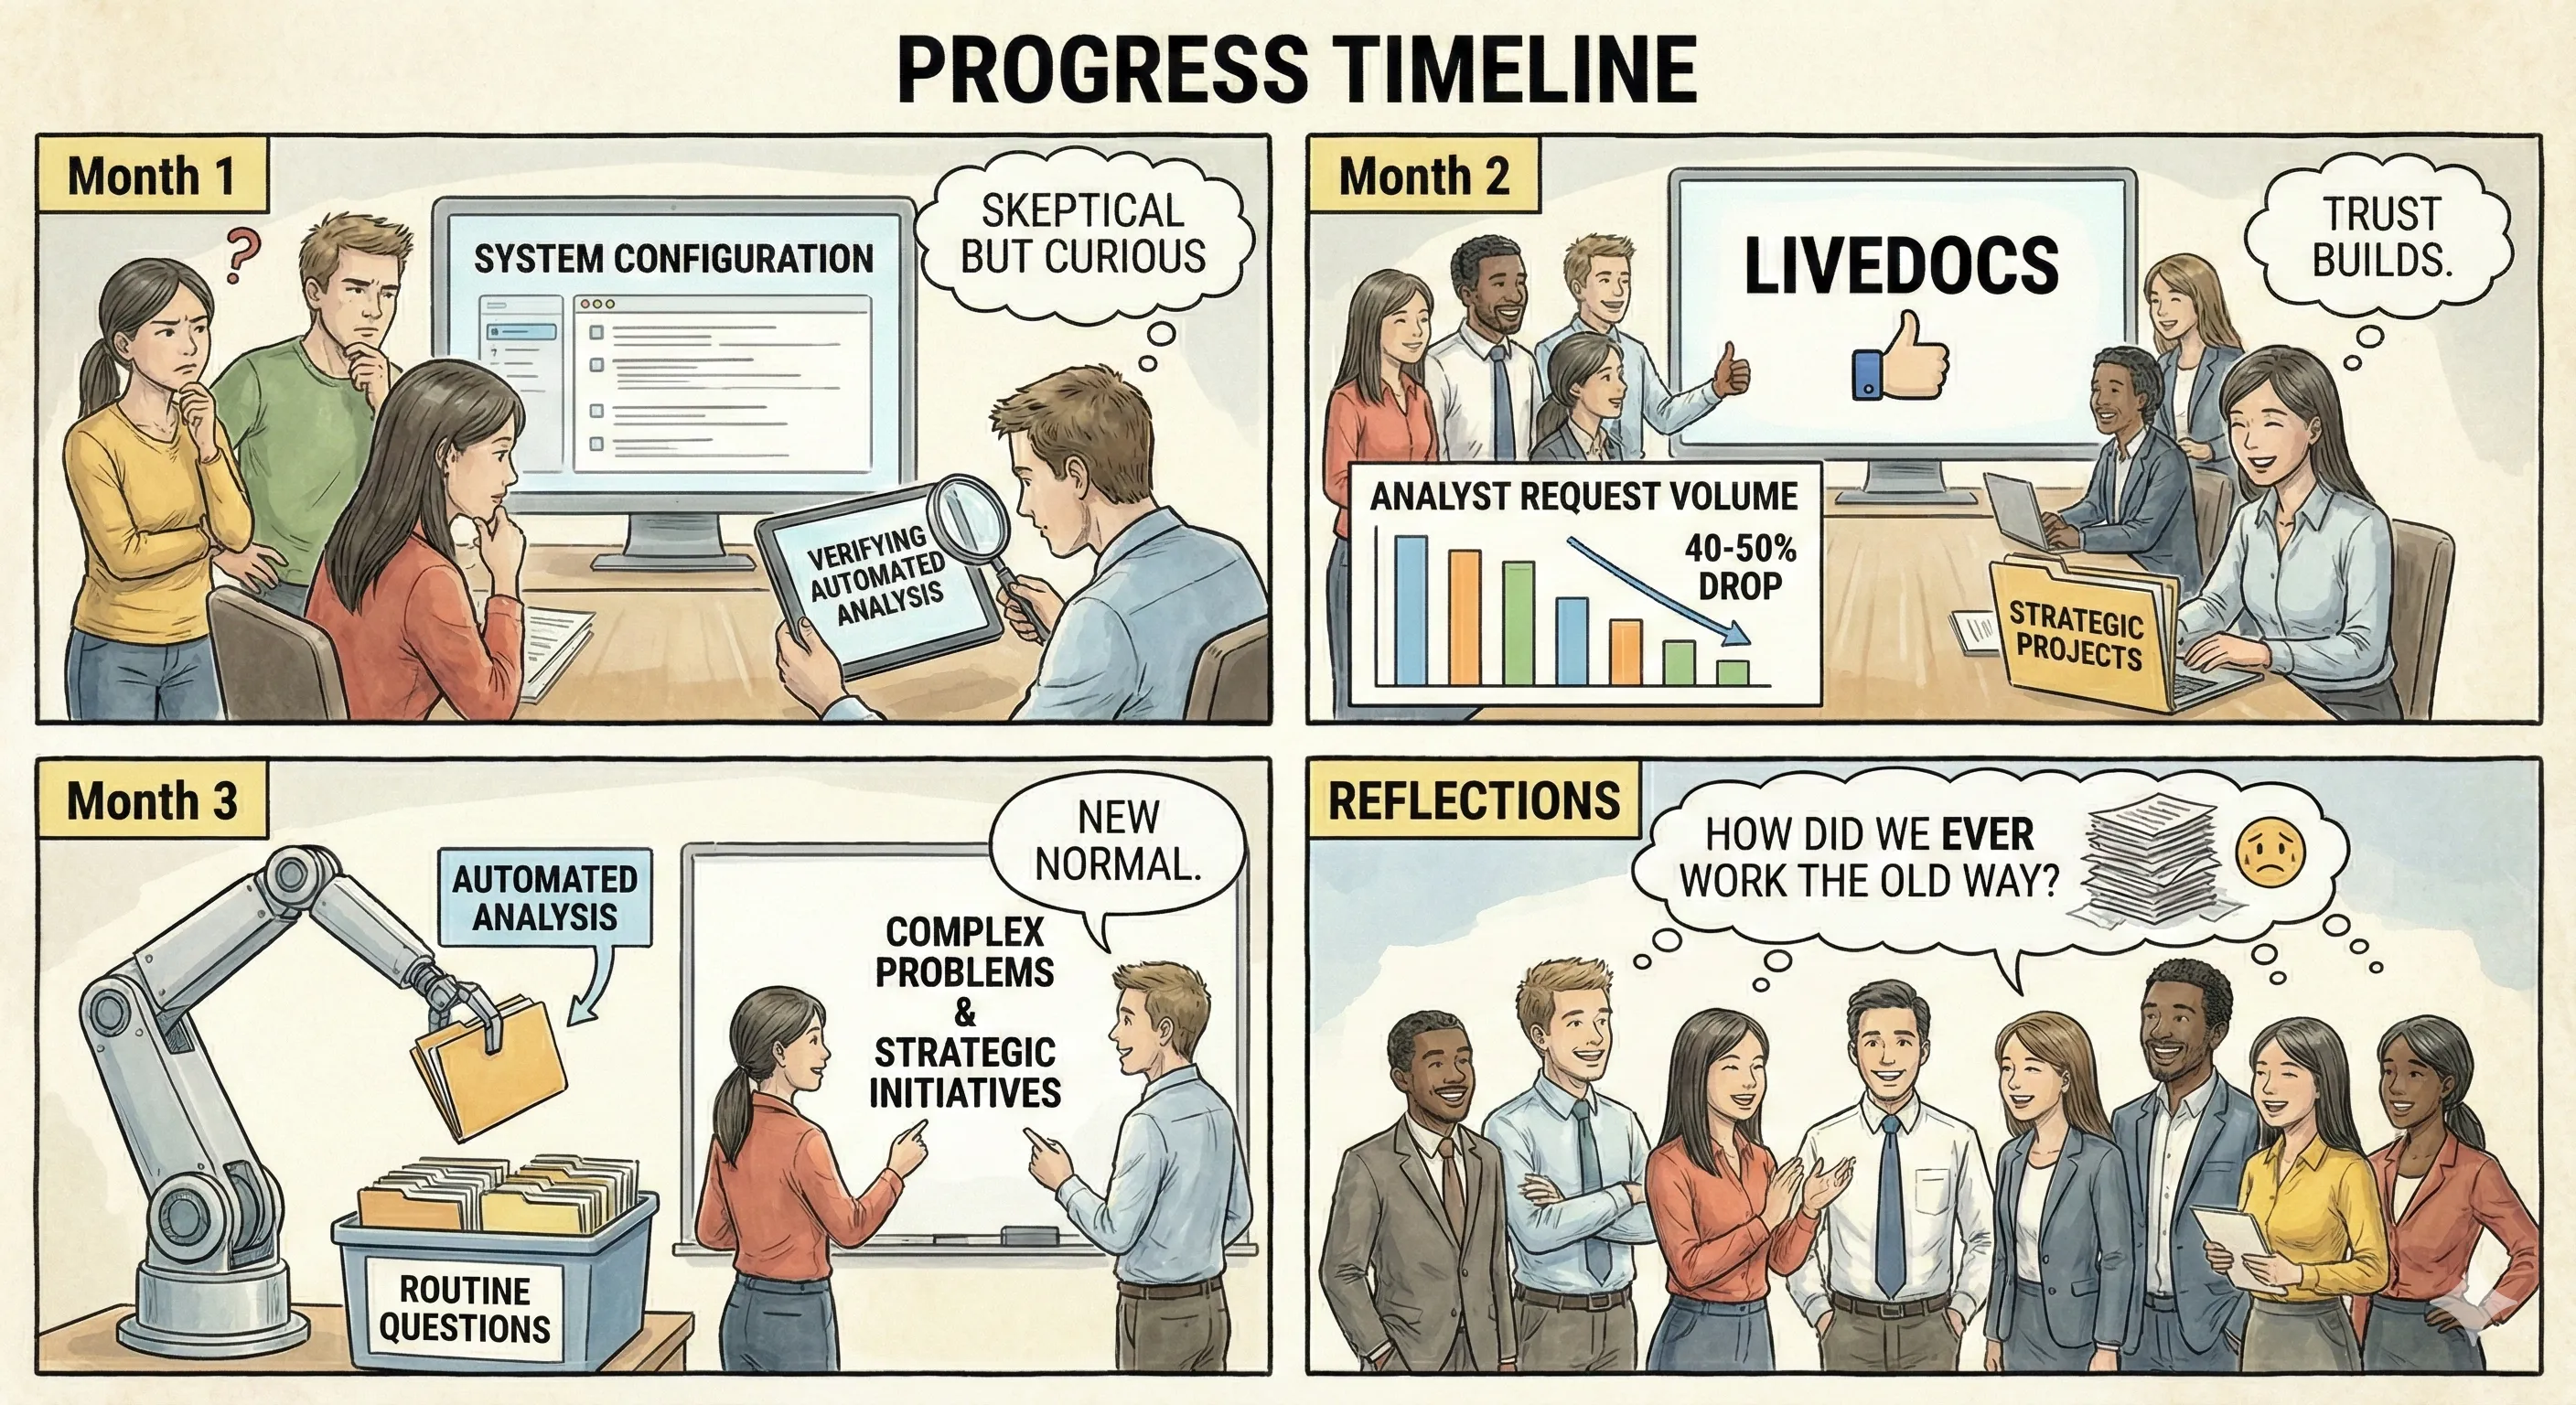
Month 1: System gets configured, analysts are skeptical but curious. Some questions start getting answered automatically. Analysts spend time verifying the automated analysis matches what they would have done manually.
Month 2: Trust builds. Teams start checking LiveDocs first before asking analysts. Analyst request volume drops 40-50%. Analysts start picking up strategic projects they’d been putting off.
Month 3: The new workflow becomes normal. Automated analysis handles most routine questions. Analysts focus on complex problems and strategic initiatives. Everyone wonders how they ever worked the old way.
It’s not instant, but it’s faster than you’d expect.
The Future of Data Teams
Here’s where this is all heading: data teams will increasingly focus on questions worth asking rather than answering the questions being asked.
The mechanical work of data extraction, segmentation, and exploratory analysis will be automated. Analysts will work on problems that require genuine expertise: building models, designing experiments, identifying opportunities, translating insights into strategy.
Companies that figure this out early will move faster and make better decisions than companies still stuck in the analyst-dependent reporting model.
Livedocs isn’t the only tool in this category, but it’s one of the few that actually works in practice rather than just marketing slides. It’s built specifically to handle the investigative work that buries analysts in routine requests.
Final Thoughts
Your analysts are too talented to spend their days fulfilling data requests. They know it. You know it. Everyone knows it. But without automation, there’s no alternative.
Analyst-dependent reporting made sense when data analysis required human effort for every step. But we’re past that now. The mechanical parts, extraction, segmentation, pattern identification, can be automated. Should be automated.
Livedocs does exactly that. It doesn’t replace your analysts. It replaces the work that was preventing them from being analysts.
Your team gets their time back. Your business gets faster insights. Your decisions get better data behind them. And your analysts get to do work that actually matters.
That’s not just more efficient, it’s fundamentally better for everyone involved.
Stop making your smartest people act like human query machines. Give them tools that handle the mechanical work automatically. Let them do what they’re actually good at: thinking strategically about your data and finding insights that drive your business forward.
Because the difference between an analyst who spends their day answering routine questions and an analyst who spends their day identifying strategic opportunities? That difference is probably worth more than whatever you’re paying for the automation tool.
The best, fastest agentic notebook 2026? Livedocs.
- 8x speed response
- Ask agent to find datasets for you
- Set system rules for agent
- Collaborate
- And more
Get started with Livedocs and build your first live notebook in minutes.
- 💬 If you have questions or feedback, please email directly at a[at]livedocs[dot]com
- 📣 Take Livedocs for a spin over at livedocs.com/start. Livedocs has a great free plan, with $10 per month of LLM usage on every plan
- 🤝 Say hello to the team on X and LinkedIn
Stay tuned for the next tutorial!
Ready to analyze your data?
Upload your CSV, spreadsheet, or connect to a database. Get charts, metrics, and clear explanations in minutes.
No signup required — start analyzing instantly

