Case Study: Big 5 Tech Layoffs And Future
We’re living through one of the most dramatic workforce reshuffles in tech history, and yet most of us are still trying to figure out what it all means.
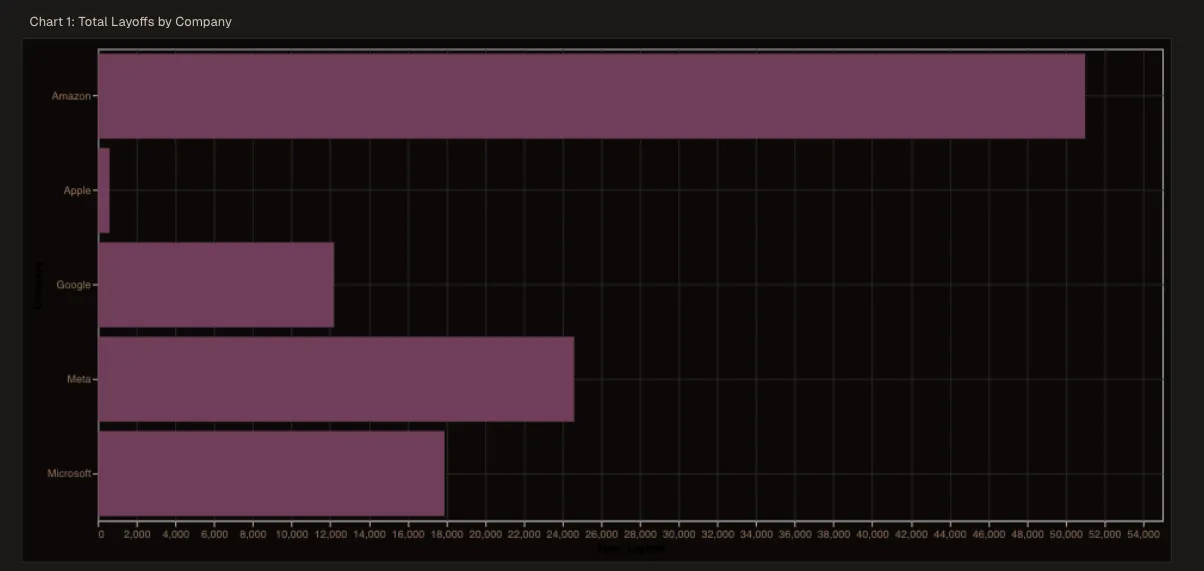
Between 2022 and early 2025, the five biggest tech companies—Apple, Google, Microsoft, Amazon, and Meta, cut over 106,000 jobs. That’s not a small team getting trimmed; that’s entire cities’ worth of talent suddenly looking for work.
Here we are using Livedocs to dig into a fascinating data analysis notebook that breaks down exactly what happened, who got hit hardest, and what patterns emerged from the chaos. Honestly, the findings are both surprising and sobering.
You can access the notebook here
What We’re Looking At Here
The notebook in question pulls together layoff data from multiple sources spanning 2020 through early 2025, with a laser focus on what people call the “Big 5” tech giants.
The analysis doesn’t just count bodies (though it does that too). It maps out timing, attempts to correlate layoffs with stock performance, and even takes a crack at predicting future risk levels for each company. That’s ambitious stuff, and honestly? Pretty useful if you’re trying to understand where the industry’s headed.
The Numbers That Tell the Story
Between 2022 and 2025, we saw 13 major restructuring events across these five companies. Not 13 small adjustments, 13 major waves that collectively displaced 106,300 people from their jobs.
But here’s the thing that caught my attention: not all companies approached this the same way.
The Risk Score Breakdown
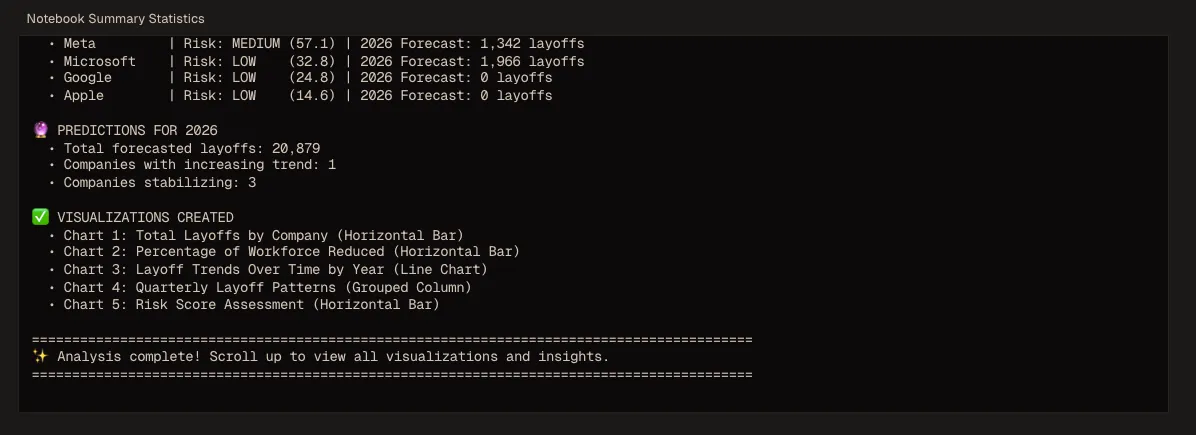
The notebook creates something called a “risk score” for each company, basically a way to quantify how vulnerable each organization might be to future layoffs. Let me walk you through what they found:
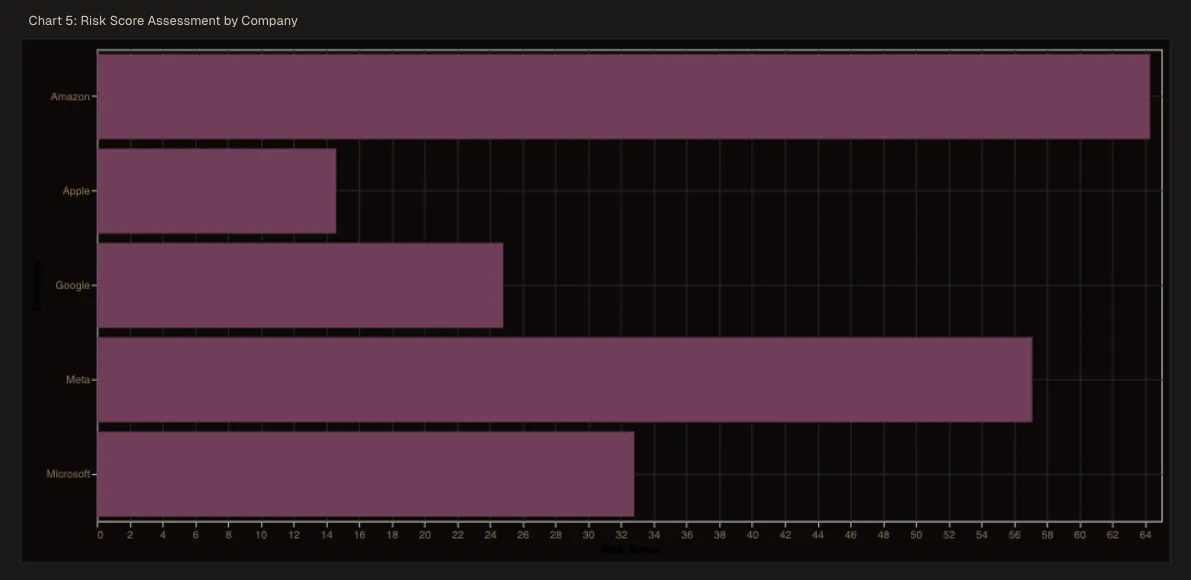
Apple (Risk Score: 14.6 - LOW)
Apple’s the quiet one in this story. Relatively speaking, they’ve been incredibly conservative with workforce reductions. Their low risk score suggests they either hired more carefully during the boom years, or they’ve got enough cash cushion to ride out economic uncertainty without panicking. Maybe both? Apple’s always been famously cautious about expansion, and it shows here.
Microsoft (Risk Score: 32.8 - LOW)
Microsoft sits at the high end of “low risk,” which is interesting considering they’ve made several rounds of cuts, particularly in their gaming division after the Activision Blizzard acquisition. The company employs over 220,000 people, so even significant layoffs represent a smaller percentage of their total workforce. Still, that 32.8 score suggests they’re not entirely out of the woods.
Amazon (Risk Score: 64.3 - MEDIUM)
Now we’re getting into different territory. Amazon’s score jumps into the medium risk category, and if you’ve been following tech news, this probably doesn’t surprise you. Amazon went on an absolute hiring spree during the pandemic—they nearly doubled some divisions—and they’ve been unwinding that aggressive expansion ever since. The company has reduced its workforce by approximately 27,000 since the start of 2022 to cut costs, which represents one of the most dramatic workforce contractions in the sector.
Meta (Risk Score: 57.1 - MEDIUM)
Meta rounds out the analysis with a medium risk score that’s actually lower than Amazon’s, despite Meta being the poster child for tech layoffs in many ways. Mark Zuckerberg called 2023 the “year of efficiency,” and boy, did they commit to that theme. Meta is laying off 5% of its staff based on performance ratings, and they’ve been pretty transparent about raising the bar on what they expect from employees.
The Correlation Nobody Expected
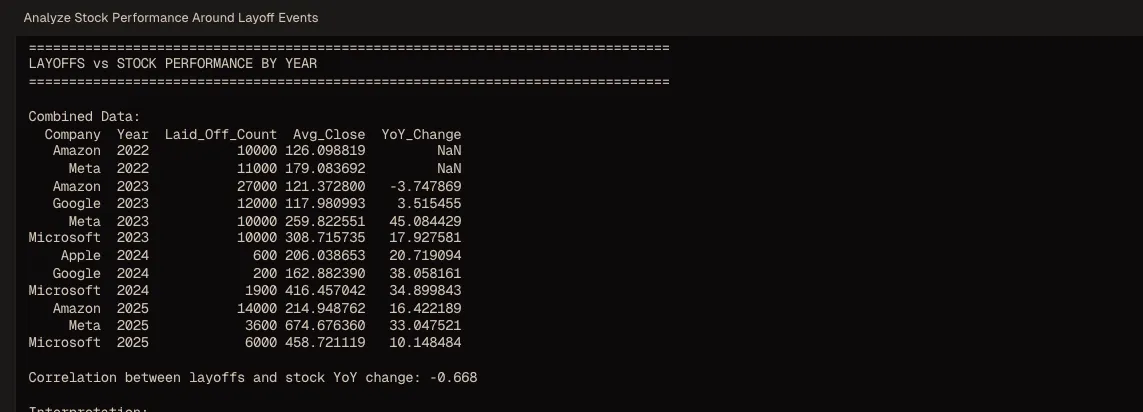 One of the more intriguing sections of this notebook attempts to correlate layoff announcements with stock market performance. This is where things get psychologically fascinating, because you’d think investors would punish companies for layoffs, right? Bad news, people losing jobs, negative press coverage?
Nope. In many cases, stock prices jumped after layoff announcements. Wall Street’s logic goes something like this: layoffs mean cost-cutting, cost-cutting means protecting margins, protecting margins means better shareholder returns. It’s brutally transactional, and it explains why some CEOs almost seemed eager to announce workforce reductions.
The notebook maps this out across different companies and time periods, showing that the market’s response isn’t uniform—timing matters, economic conditions matter, and the narrative the company tells matters just as much as the raw numbers.
Predicting the Future
Here’s where the analysis gets really ambitious: using historical patterns to forecast future layoff risk. Now, I’ll be honest, predicting something as human-driven as corporate layoffs is tough.
There are so many variables: CEO personalities, board pressure, competitive dynamics, technological disruption, macroeconomic shifts.
But the notebook takes a shot at it anyway, building predictive models based on historical data. The methodology seems to focus on factors like:
- Previous layoff patterns and recovery times
- Revenue trends and growth trajectories
- Market conditions and investor sentiment
- Company-specific factors like debt levels and cash reserves
The resulting risk scores (those numbers we talked about earlier) come from this predictive framework. They’re not guarantees, nothing in data analysis ever is, but they’re educated guesses based on actual patterns.
What the Patterns Actually Reveal
Step back from the individual companies for a moment, and some broader patterns emerge that the notebook highlights.


The Stabilization Trend
According to the analysis, the tech layoff wave appears to be stabilizing for most companies. We’re not seeing the massive, headline, grabbing cuts of 2023 as frequently.
That doesn’t mean layoffs have stopped, so far in 2025, there have been 596 layoffs at tech companies with 177,446 people impacted, but the tempo and scale have changed. Think of it less like tsunami waves and more like regular tides.
The New Equilibrium
Here’s something crucial the notebook points out: the industry isn’t returning to pre-2022 hiring levels. Instead, we’re settling into what the analysis calls “a new equilibrium focused on AI-enhanced productivity and operational efficiency.”
That phrase, AI-enhanced productivity, is doing a lot of heavy lifting. What it really means is that companies are betting they can maintain or grow output with fewer humans by leaning harder on automation and AI tools. Whether that bet pays off remains to be seen, but it’s driving a lot of current decision-making.
The Notable Exceptions
The analysis explicitly mentions that while most companies are stabilizing, there are “notable exceptions.” It doesn’t spell out who these exceptions are in the excerpt we have, but based on current news, we can make educated guesses.
Companies still struggling with profitability, startups running out of runway, and organizations in sectors being disrupted by AI are probably the ones still wielding the axe.
The Methodology
Let me geek out for a second about how this analysis was constructed, because it matters. The notebook pulls from multiple reliable sources, that’s important because layoff numbers are often messy, incomplete, or contradictory depending on who’s reporting them.
The approach seems to be:
- Data aggregation: Pulling together publicly announced layoffs, SEC filings, news reports, and probably some proprietary datasets
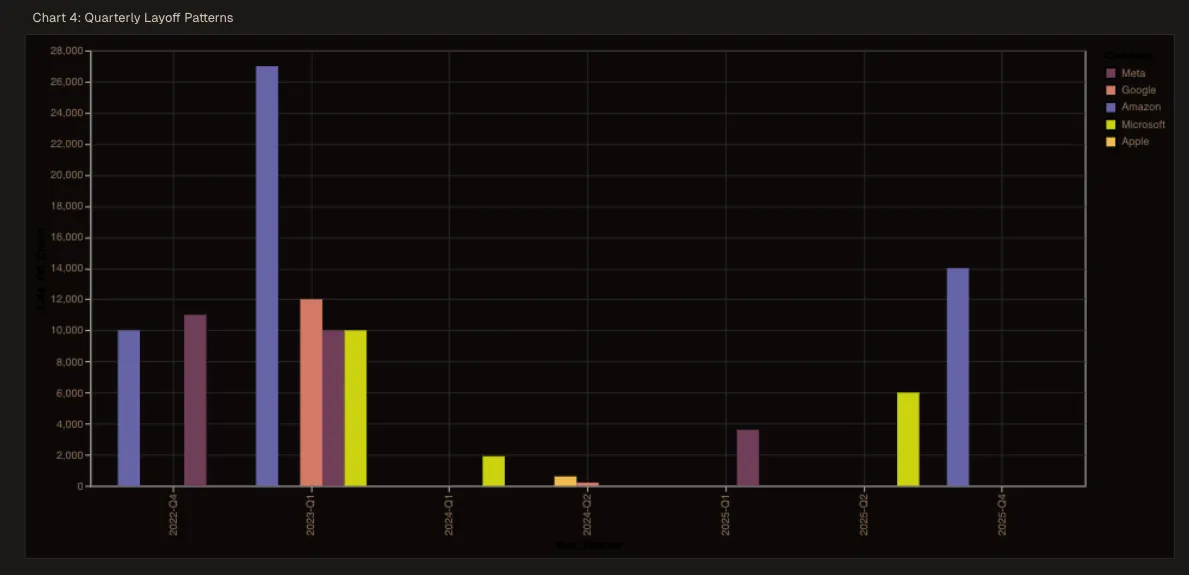
- Temporal analysis: Tracking when layoffs happened, how they clustered, and what preceded them
- Company comparison: Normalizing data across different company sizes to make apples-to-apples comparisons
- Visualization: Creating comprehensive charts and graphs to spot patterns humans might miss
- Predictive modeling: Building forward-looking risk assessments based on historical behavior
This multi-layered approach is what makes the analysis credible. It’s not just counting; it’s contextualizing.
Why This Analysis Matters Right Now
For Job Seekers
Those risk scores? They’re essentially a rough guide to employment stability. A company with a low risk score isn’t immune to layoffs (nothing is), but statistically, you’re in a more stable position there than at a company with a medium or high score. It’s one data point among many to consider when evaluating offers.
For Investors
Understanding layoff patterns helps predict cost structures, margin improvements, and potential earnings surprises. If a company’s risk score is climbing, that might signal upcoming restructuring—which, as we’ve discussed, the market often rewards.
For Industry Watchers
This data reveals where tech is headed strategically. The shift toward “AI-enhanced productivity” isn’t just buzzword salad; it’s a fundamental restructuring of how tech companies think about headcount and growth. We’re moving from “growth at all costs” to “efficient growth with technology leverage.”
Where Do We Go From Here?
The notebook suggests we’re entering a phase of stability and equilibrium, but I’d add some caveats to that optimistic framing.
The AI Wild Card
Every company claims they’re investing heavily in AI. If even half of those investments deliver meaningful productivity gains, we could see another wave of restructuring as roles become redundant. The notebook touches on “AI-enhanced productivity,” but that’s potentially a much bigger force than the analysis fully explores.
The Economic Environment
These predictions assume relatively stable economic conditions. If we hit a real recession (not just a slowdown), all bets are off. Those risk scores could flip dramatically as companies prioritize survival over growth.
The Talent Paradox
Here’s something interesting: even as companies lay people off, many are simultaneously hiring in specific areas—AI, security, infrastructure. The tech job market isn’t dying; it’s bifurcating. Some skills are becoming more valuable than ever; others are becoming obsolete faster than anyone expected.
Real-World Applications of This Analysis
So you’ve got this notebook full of insights and risk scores. How do you actually use it?
Scenario Planning
If you’re at a medium-risk company, you can game out scenarios. What happens if they announce a 10% cut? Which departments get hit first? What’s your personal exposure? This kind of analysis gives you the framework for that thinking.
Network Building
Knowing which companies are stable versus risky can inform where you focus your networking efforts. Building relationships at low-risk organizations might pay off if you suddenly need to activate your job search.
Compensation Negotiations
Risk should factor into how much you ask for. A position at a medium-risk company arguably deserves higher compensation than an identical role at a low-risk one, because you’re taking on more uncertainty.
Market Timing
For investors, understanding the layoff cycle can help with entry and exit timing. If you know restructuring is coming and how the market typically responds, you can position accordingly.
What This Tells Us About Tech’s Future
Step all the way back, and this analysis is documenting a fundamental shift in how technology companies operate. The 2010s were defined by “grow fast, figure out profitability later.” The pandemic accelerated that to absurd levels. Now we’re in the correction phase, where efficiency and sustainability matter more than headline-grabbing growth rates.
The companies that emerge strongest from this period will likely be the ones that figure out how to:
- Leverage AI genuinely rather than just talking about it
- Maintain innovation velocity with leaner teams
- Attract and retain top talent despite the instability
- Balance cost discipline with strategic investment
Those risk scores? They’re not just about layoff probability. They’re proxies for how well each company has navigated this transition.
Final Thoughts
This Livedocs notebook serves as a valuable reality check in an industry that sometimes prefers storytelling to truth-telling. The tech sector loves narratives: disruption, innovation, changing the world. Those narratives aren’t wrong, exactly, but they’re incomplete without acknowledging the messier realities of workforce management, economic cycles, and corporate survival.
The analysis shows us that yes, tech layoffs followed predictable patterns. Yes, some companies handled it better than others. Yes, we can make educated guesses about what’s coming next. But it also reminds us that we’re still figuring this out in real time. The new equilibrium isn’t fully established; we’re still in transition.
One thing’s certain: the tech industry of 2025 looks fundamentally different than 2021, and analyses like this help us understand not just what changed, but why—and what might come next.
You can access the notebook here
You can build a notebook like this too! Use Livedocs.
- 8x speed response
- Ask agent to find datasets for you
- Set system rules for agent
- Collaborate
- And more
Get started with Livedocs and build your first live notebook in minutes.
- 💬 If you have questions or feedback, please email directly at a[at]livedocs[dot]com
- 📣 Take Livedocs for a spin over at livedocs.com/start. Livedocs has a great free plan, with $10 per month of LLM usage on every plan
- 🤝 Say hello to the team on X and LinkedIn
Stay tuned for the next tutorial!
Ready to analyze your data?
Upload your CSV, spreadsheet, or connect to a database. Get charts, metrics, and clear explanations in minutes.
No signup required — start analyzing instantly

