Traditional BI Tools vs AI Data Analysis
Why does it take three days and two analysts to answer a simple business question?
You’ve got your BI tools, Tableau, Power BI, Looker, whatever enterprise stack you’ve invested thousands (or hundreds of thousands) into. They’re powerful. They’re sophisticated. They create beautiful visualizations.
And yet, when your CEO asks “why did sales drop in the Northeast region last quarter,” everyone scrambles like it’s the first time anyone’s ever asked a question.
That’s because traditional Business Intelligence tools were built for a different era. An era when having data visualized was revolutionary. When creating a dashboard was cutting-edge. But we’re past that now. Way past that.
Let’s talk about what’s actually happening with AI data analysis, and why it’s not just an incremental improvement, it’s a completely different game.
The Traditional BI Tool Reality Check
Look, I’m not here to trash BI tools. They’ve served us well. Tableau changed how we think about data visualization. Power BI democratized analytics for countless companies. Looker made data modeling more accessible. These are genuine achievements.

But let’s be honest about what these tools actually do.
They let you build reports and dashboards. You define metrics, create visualizations, set up filters. If you know what question you want to ask and how to query your data, BI tools will show you the answer in a pretty graph. That’s their job, and they do it well.
The problem? That’s where they stop.
The Human Bottleneck
Here’s the typical workflow with traditional BI tools:
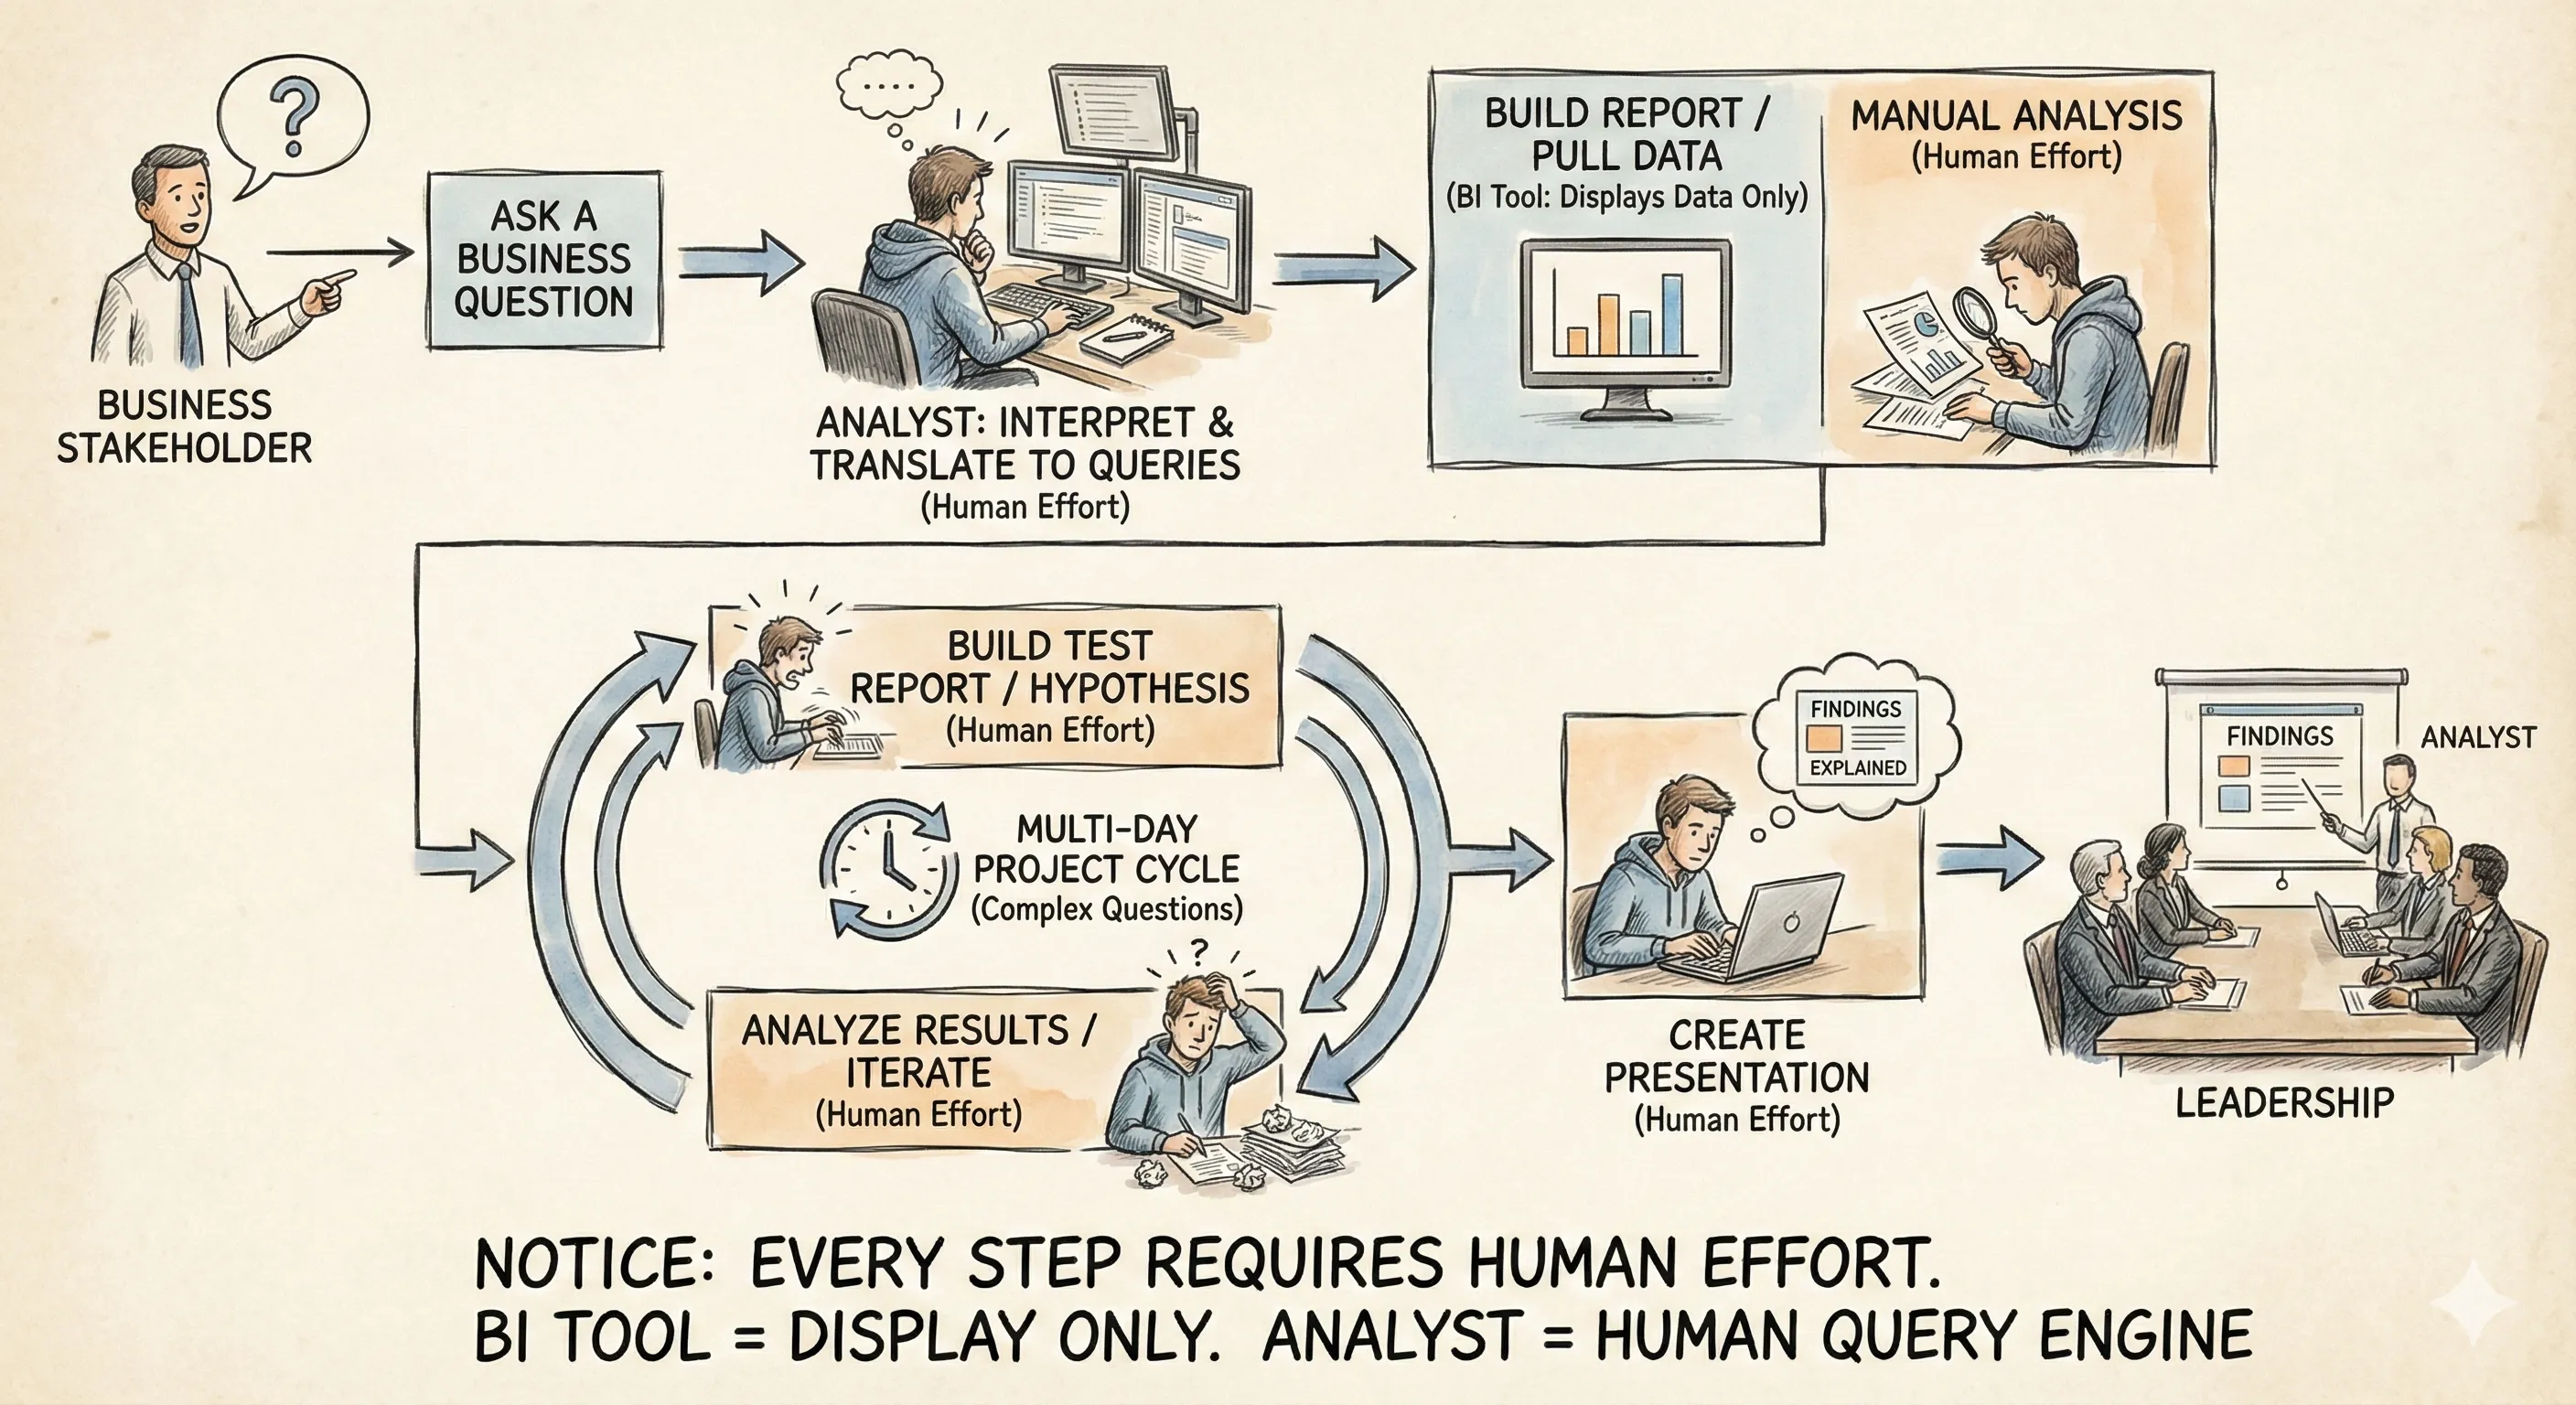
Someone asks a business question. An analyst interprets that question and translates it into data queries. They build a report or pull data from an existing dashboard. They analyze the results. They build another report to test a hypothesis. They repeat this process until they find an answer. Then they create a presentation to explain what they found.
Notice something? Every single step requires human effort. The BI tool isn’t doing analysis, it’s just displaying data. You’re doing the analysis.
And if the question is complex? If it requires looking at data from multiple angles, testing various hypotheses, segmenting across different dimensions? That’s when a simple question turns into a multi-day project.
I’ve seen companies with entire teams dedicated to answering ad-hoc questions from leadership. Smart people spending their days as human query engines, manually investigating every “why did this happen” question that comes their way.
The Questions BI Tools Can’t Answer
Traditional BI tools are fantastic at answering descriptive questions:
- What was our revenue last quarter?
- How many new customers did we acquire?
- What’s our current churn rate?
But they struggle with diagnostic questions:
- Why did revenue drop in that region?
- Which factors are driving customer acquisition?
- What’s causing churn to increase?
And they’re completely lost on predictive or prescriptive questions:
- What’s likely to happen next month?
- Which customers are at risk?
- What should we focus on to improve results?
You can technically answer these questions using BI tools, but it requires manual analysis, statistical knowledge, and a lot of time. The tool itself isn’t helping, it’s just showing you data while you figure things out.
What AI Data Analysis Actually Means
Okay, so everyone’s talking about AI now. Every software company suddenly has “AI-powered” in their marketing. Most of it is… let’s call it “optimistic branding.” But there’s something real happening beneath the hype.
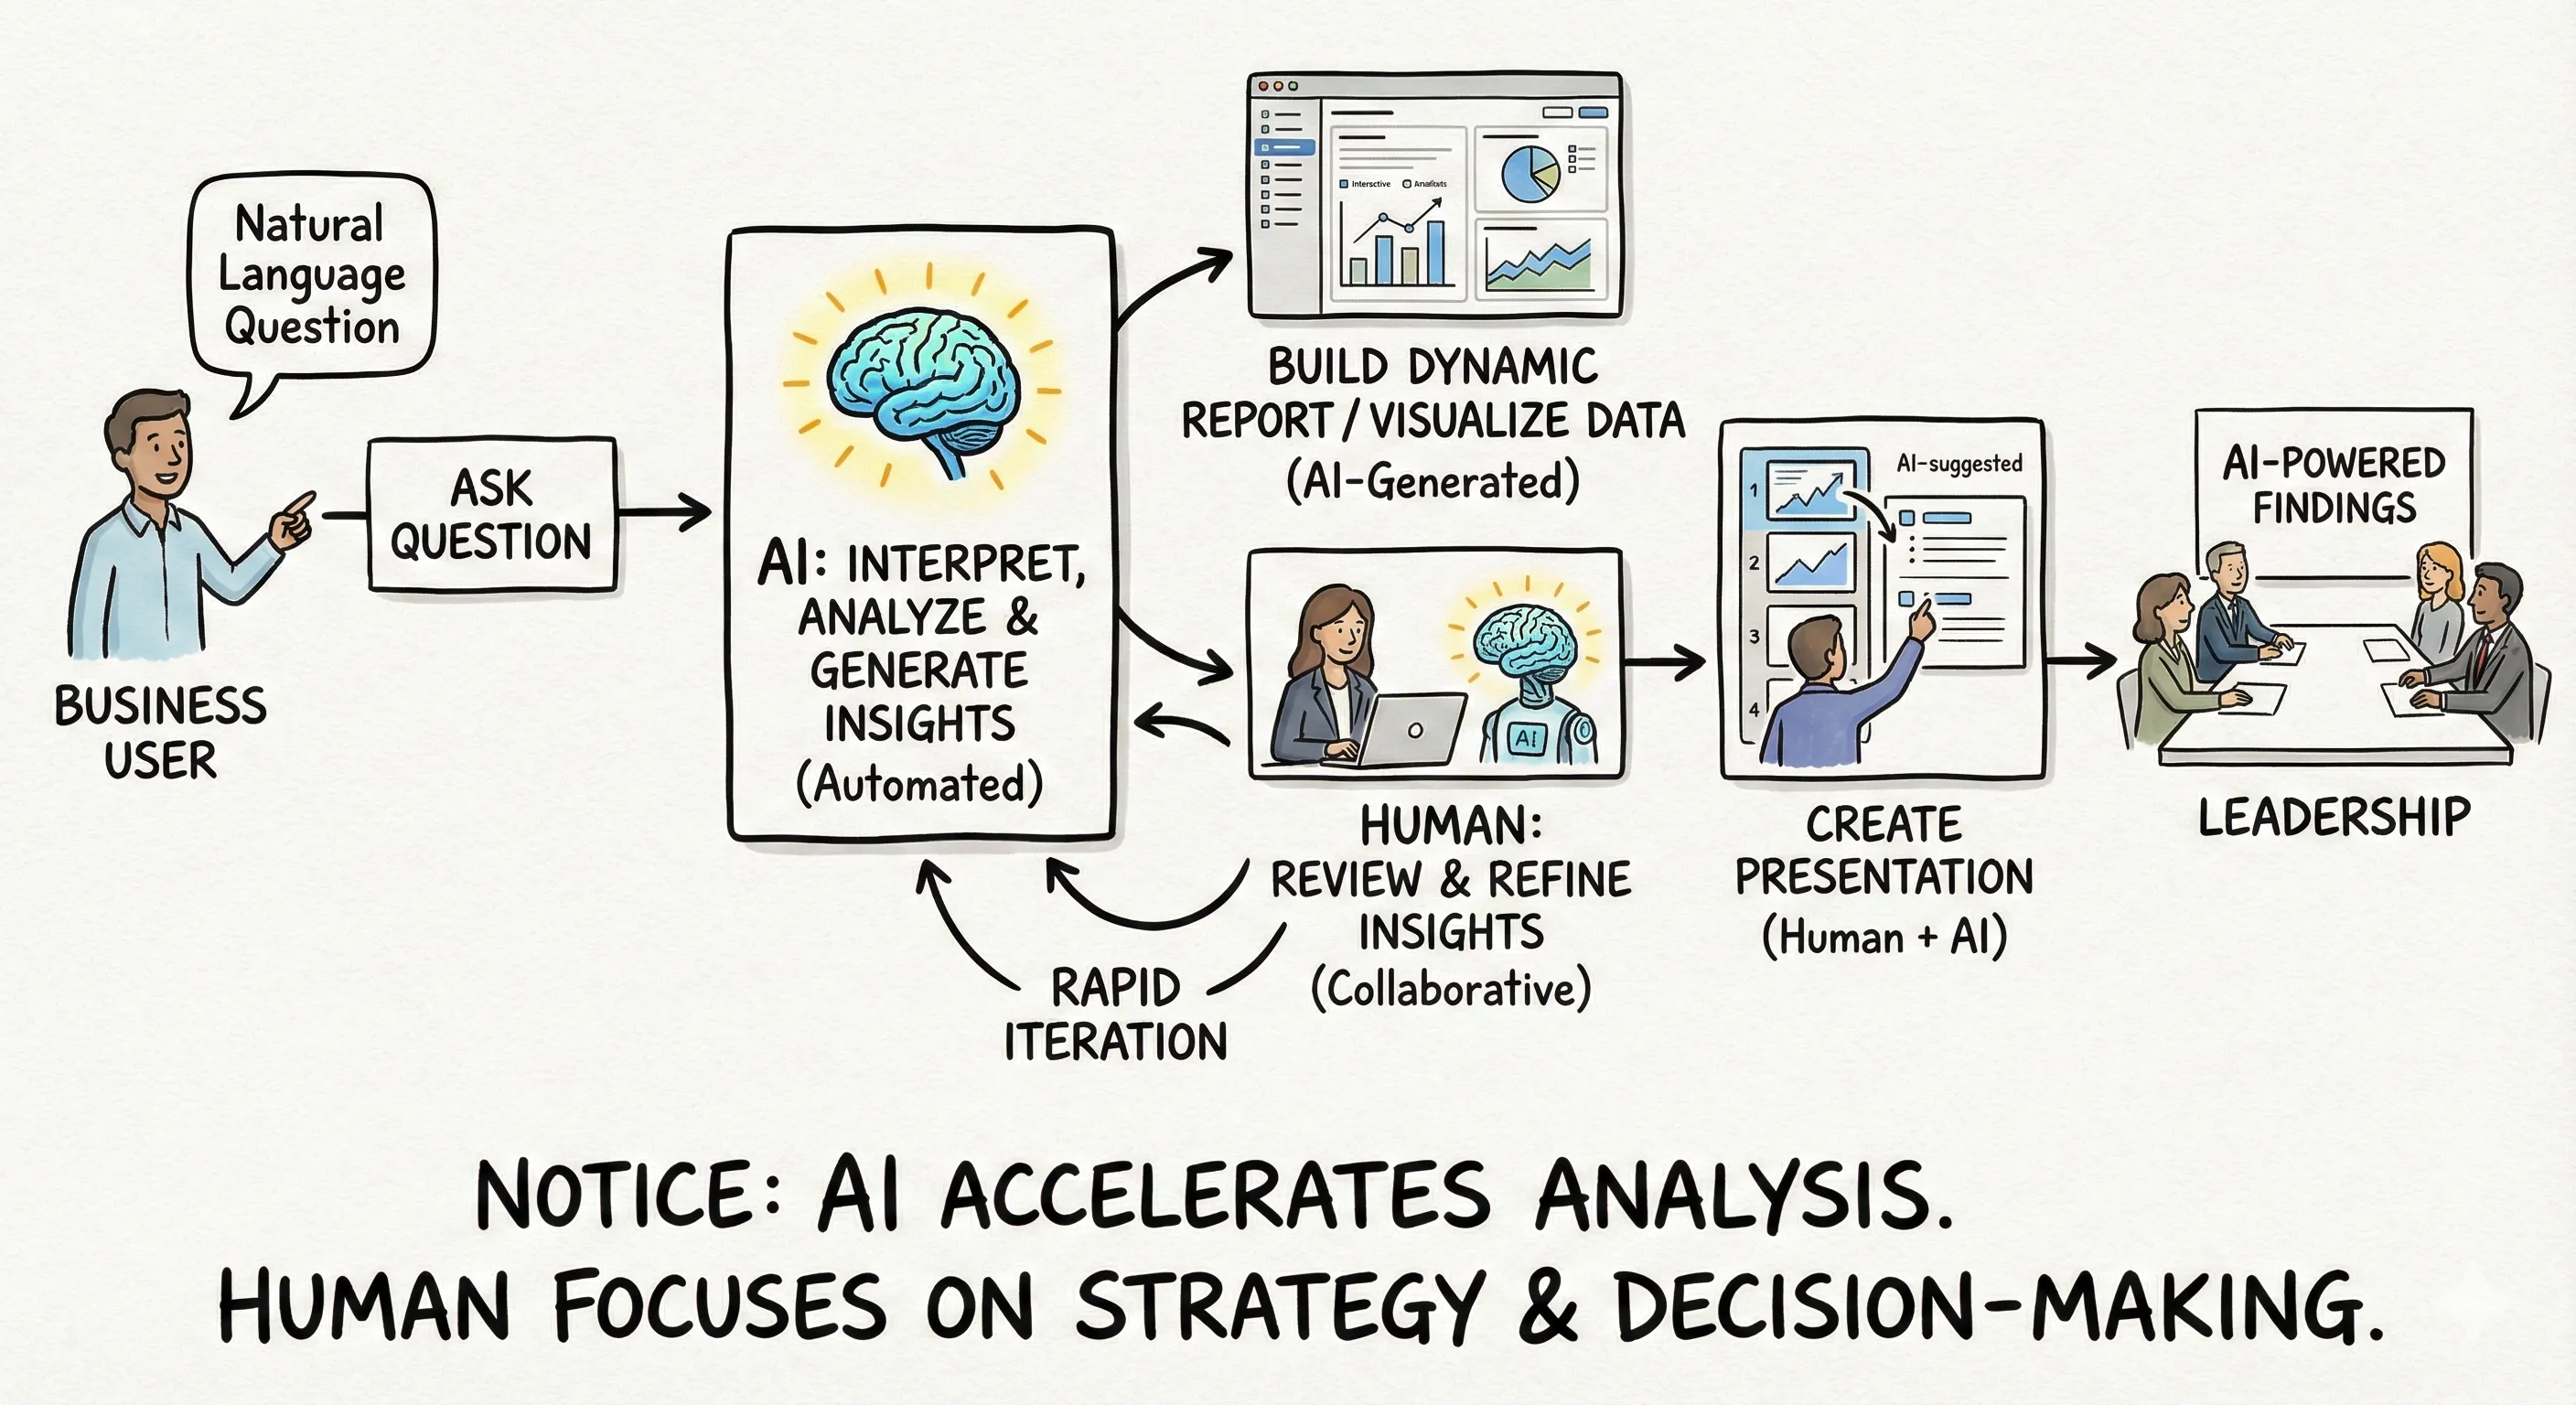
Real AI data analysis isn’t about chatbots that write SQL queries for you (though that’s mildly useful). It’s about systems that actually perform analysis autonomously. That investigate your data, identify patterns, test hypotheses, and surface insights without requiring you to manually drive every step.
Think about how you’d analyze a problem manually. You’d segment your data different ways. You’d look for anomalies. You’d test correlations. You’d compare cohorts. You’d run statistical tests to determine what’s significant versus what’s just noise.
That’s exhausting. And slow. And requires expertise most people don’t have. AI data analysis automates this entire process. It’s not replacing human judgment, it’s replacing the mechanical work of exploration that comes before judgment.
The Fundamental Shift
Here’s the core difference: traditional BI tools answer the questions you ask them. AI data analysis figures out what questions you should be asking.
Let me give you a concrete example. You notice conversion rates dropped last month. With a BI tool, you start investigating. You segment by channel, nothing obvious. You segment by customer type, still unclear. You look at time of day, day of week, geography, device type. You build hypothesis after hypothesis.
With AI data analysis, the system automatically runs this investigation. It segments across every relevant dimension, identifies where the drop is most pronounced, determines statistical significance, and tells you: “Conversion rate decreased 23% among mobile users in the checkout flow, specifically on iOS devices after the latest app update.”
Same answer. One took you six hours. The other took sixty seconds.
Traditional BI tools answer the questions you ask them. AI data analysis figures out what questions you should be asking.
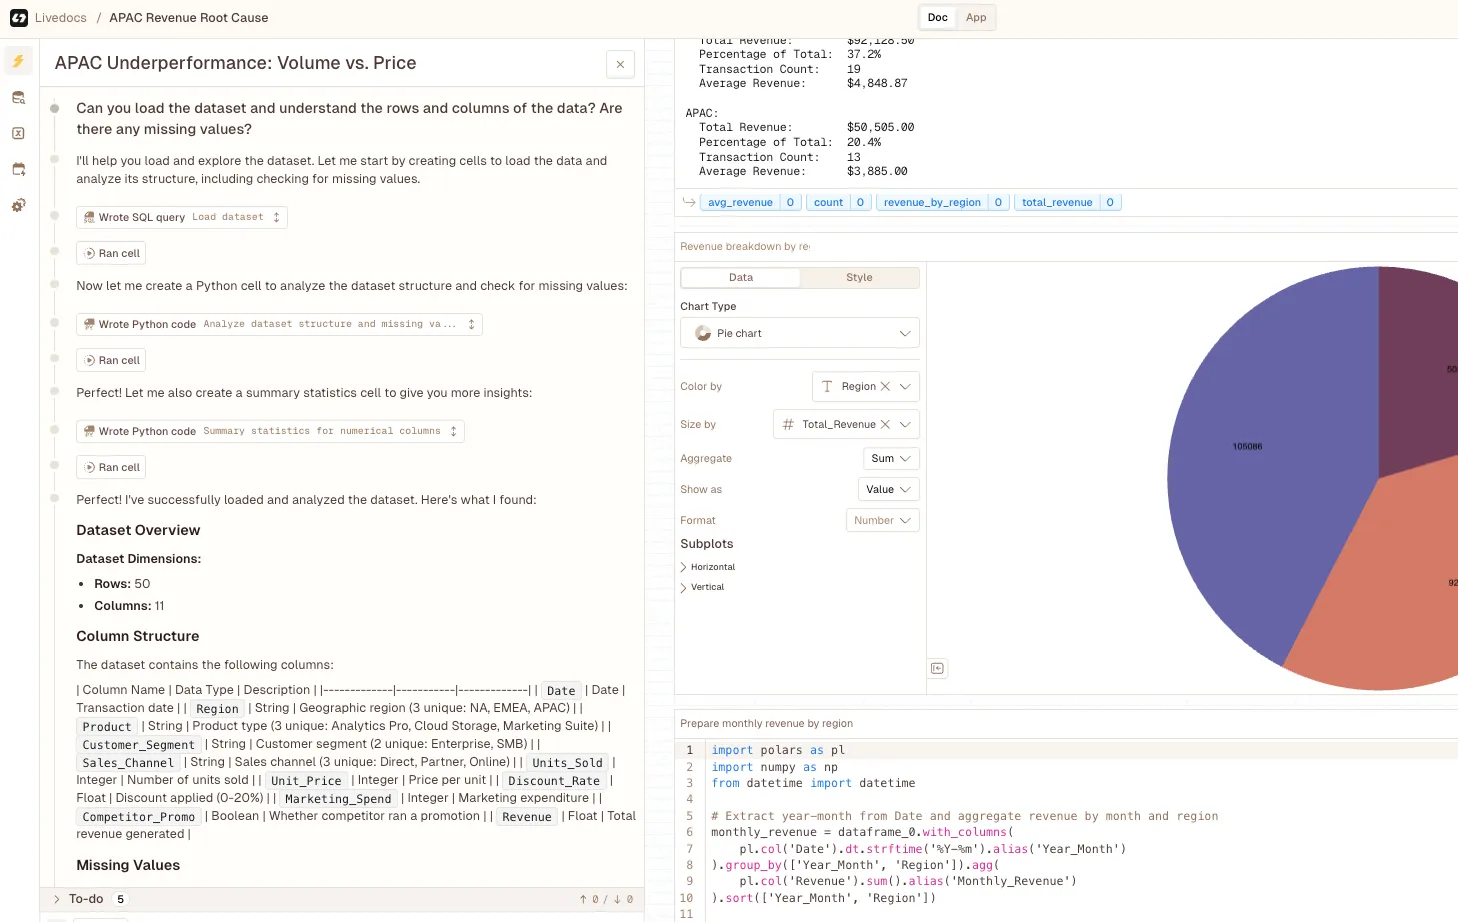
Livedocs: What AI Data Analysis Looks Like in Practice
This is where Livedocs comes into the picture, and honestly, it’s one of the few tools I’ve seen that actually delivers on the AI promise without requiring you to become a data scientist.
Here’s what makes it different: Livedocs continuously monitors your key metrics and automatically investigates changes. Not when you ask it to. Not when you have time to build a report. Continuously.
When something significant happens, revenue shifts, conversion drops, churn spikes, whatever metrics matter to your business, the platform immediately runs a comprehensive root cause analysis. It’s like having a team of analysts working 24/7, investigating every meaningful change in your data.
How It Actually Works
The technical side is genuinely interesting. Livedocs connects to your existing data sources (your data warehouse, CRM, product analytics, wherever your business data lives). It ingests that data and builds a continuous understanding of your business metrics.
Then it applies a bunch of AI techniques, machine learning models, statistical analysis, pattern recognition, to identify what’s driving changes in those metrics. It segments your data across dozens or hundreds of dimensions simultaneously, looking for the specific combinations of factors that explain what’s happening.
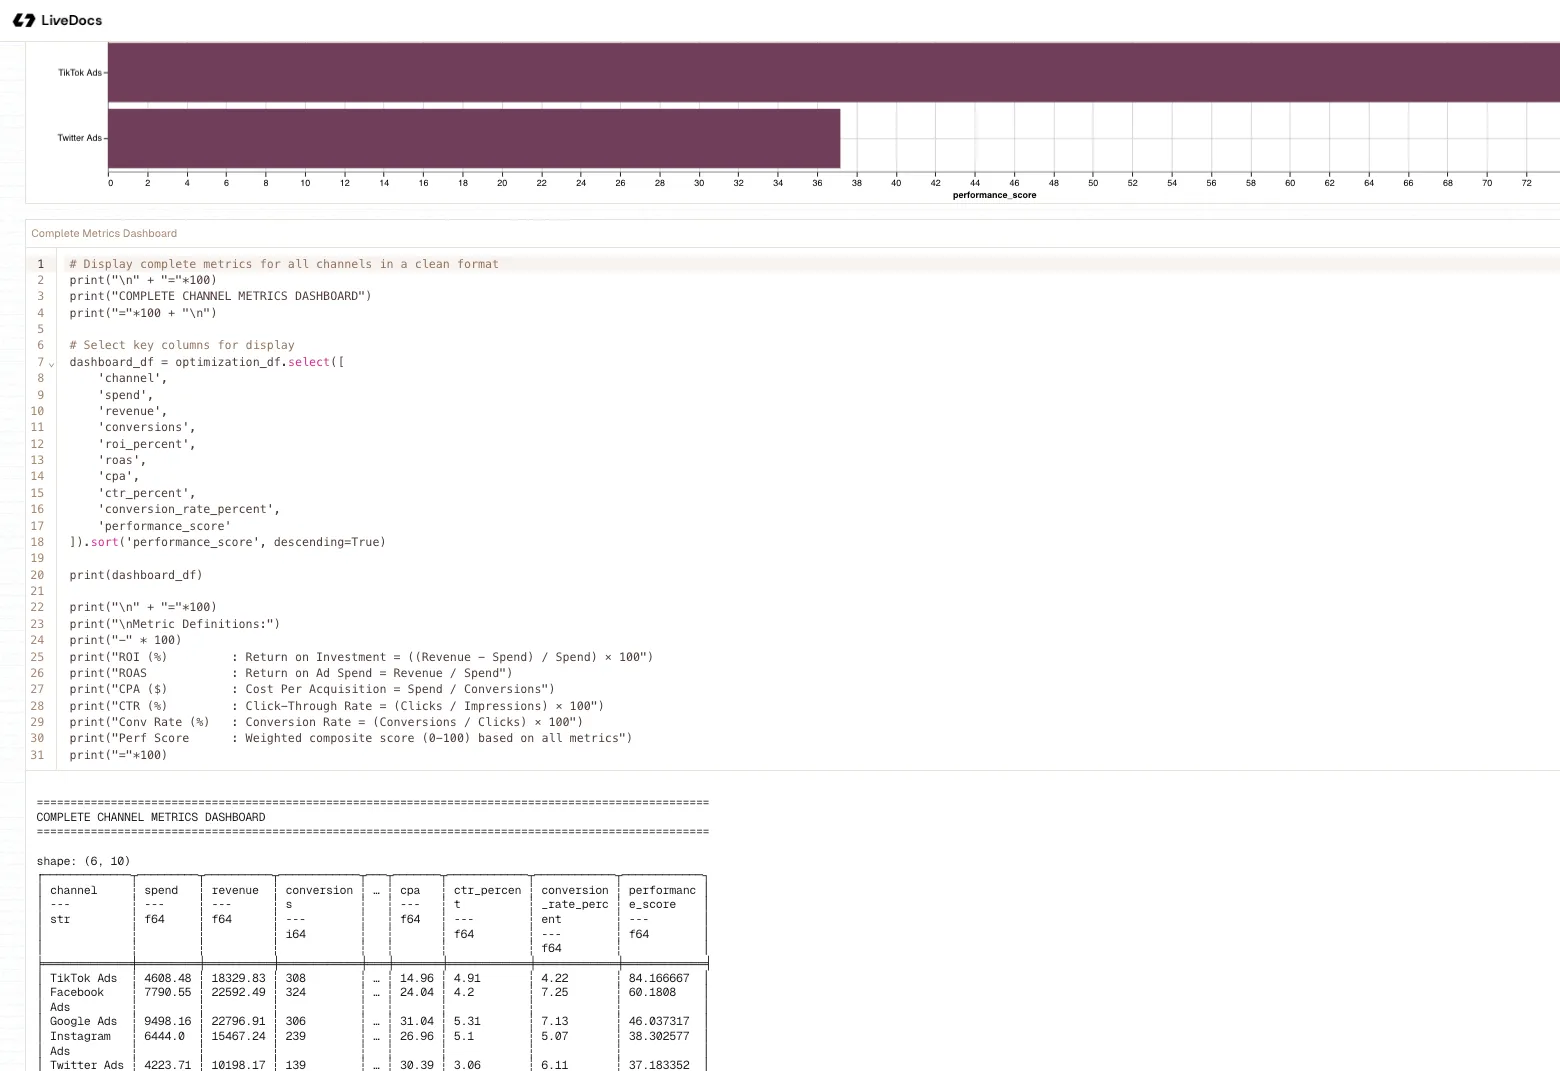
But here’s the clever part: it presents all this analysis in plain English. You don’t see SQL queries or statistical formulas.
You see explanations like: “Sales decreased 15% this week, primarily driven by longer sales cycles in enterprise deals over $100K, particularly in the financial services vertical where budget freezes have extended decision timelines.”
That’s actionable intelligence, not just data visualization
The Speed Difference Is Absurd
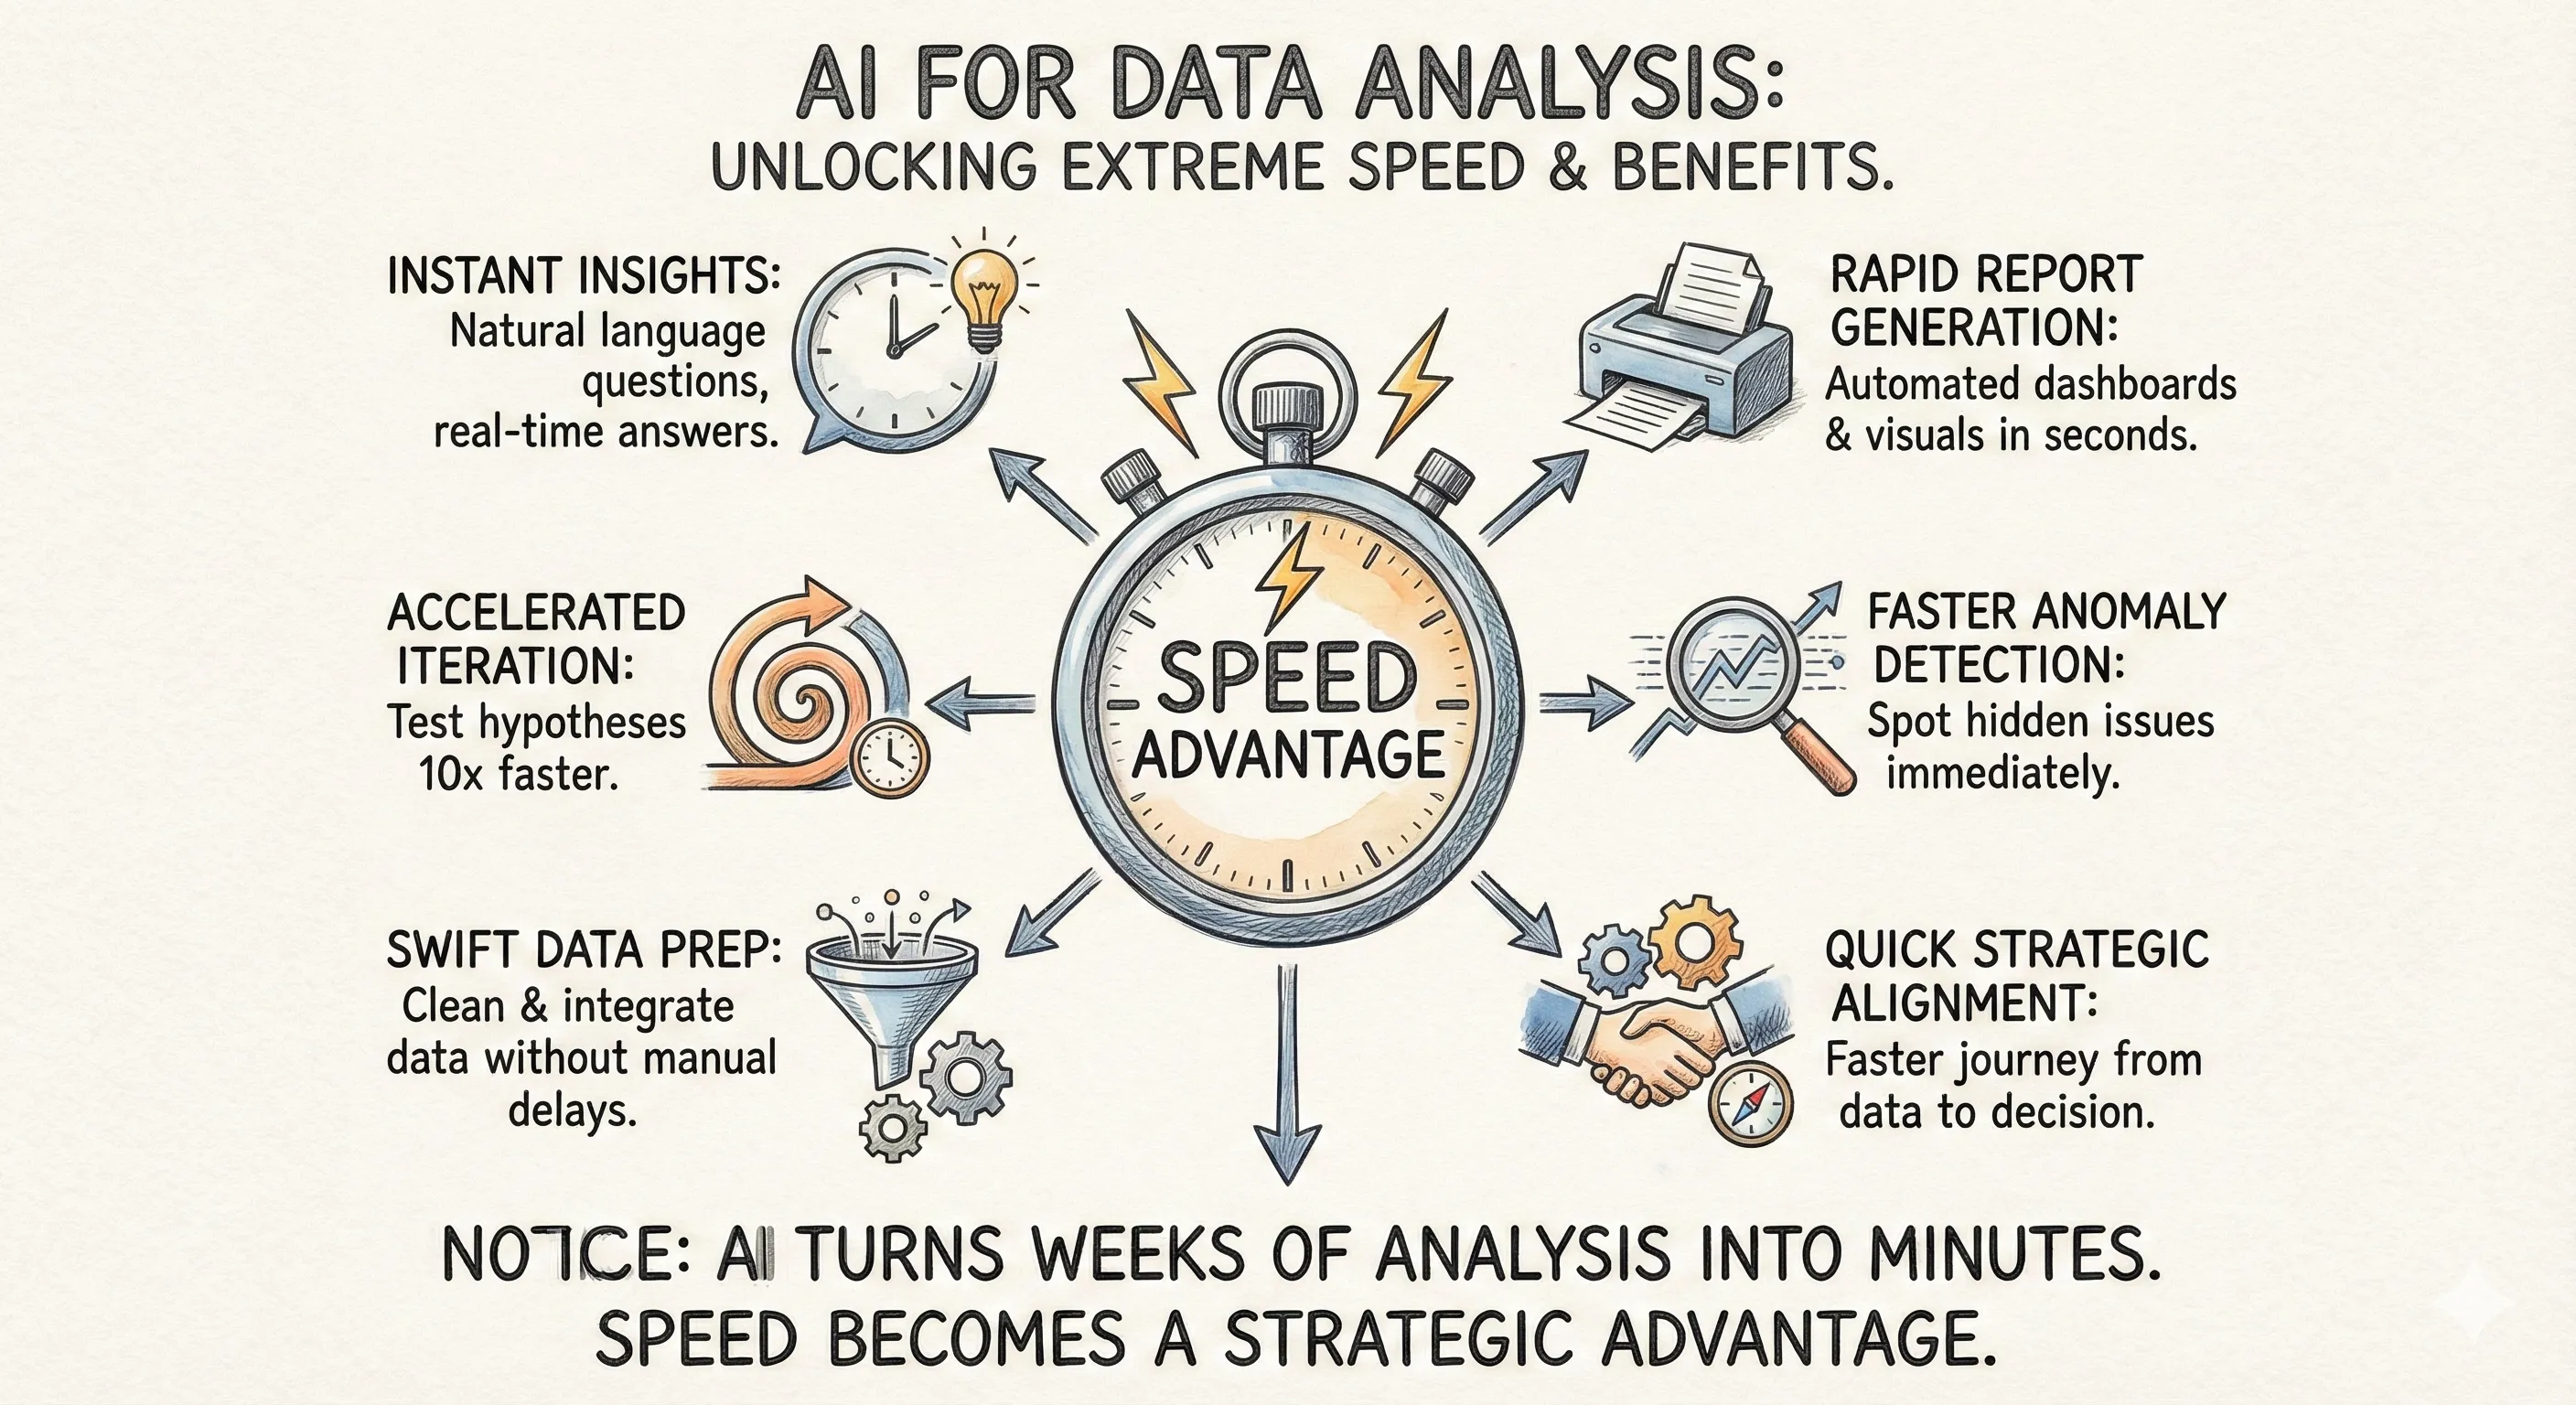 I keep coming back to speed because it genuinely changes everything. Questions that took days to answer now get answered in real-time.
Your head of sales asks why pipeline velocity slowed down? Livedocs has already analyzed it and shows you it’s because your AEs are spending 40% more time on discovery calls, which correlates with higher win rates but longer cycles. That insight took thirty seconds to retrieve.
Your CFO wants to know why operating expenses increased? The system shows you it’s driven by higher customer acquisition costs in paid channels, specifically LinkedIn ads targeting enterprise buyers, which have become 28% more expensive over the last quarter while conversion rates held steady.
These aren’t simple lookups. These are multi-dimensional analyses that would require building custom reports, running statistical tests, and validating hypotheses. But they’re instant because the AI is continuously performing this analysis in the background.
Traditional BI vs AI: The Real Comparison
Let’s break down the actual differences, because this isn’t about one being “better”, they’re fundamentally different tools for different purposes.
Analysis Approach
- Traditional BI: You define what to measure and how to slice it. The tool displays what you configured.
- AI Analysis: The system determines what’s significant and investigates automatically.
Speed to Insight
- Traditional BI: Hours to days, depending on complexity and analyst availability.
- AI Analysis: Real-time to minutes, with continuous monitoring.
Skill Required
- Traditional BI: Requires understanding of data models, query languages, statistical methods.
- AI Analysis: Accessible to anyone who can read explanations in plain English.
Question Types
- Traditional BI: Answers descriptive questions (what happened).
- AI Analysis: Answers diagnostic questions (why it happened) and predictive questions (what might happen).
Scope of Investigation
- Traditional BI: Limited to the dimensions you think to check.
- AI Analysis: Explores all relevant dimensions automatically.
Where Traditional BI Still Wins
Let’s be fair, there are things traditional BI tools do better. If you need highly customized visualizations, BI tools offer more control. If you have specific reporting requirements that need to look exactly a certain way, BI tools are more flexible.
And honestly? Some people just prefer building their own queries and reports. There’s satisfaction in crafting the perfect dashboard. I get it.
But that’s a preference about control and craft, not about effectiveness or efficiency. It’s choosing the scenic route because you enjoy driving, not because it gets you there faster.
The Workflow Transformation
Here’s what actually changes when you shift from traditional BI to AI data analysis. It’s not just about tools, it’s about how your team operates.
With traditional BI, your data team spends most of their time responding to requests. Someone asks a question, they investigate, they report back. It’s reactive. It’s transactional. And it means your analysts are stuck in support mode instead of doing strategic work.
With AI data analysis through something like Livedocs, the system handles the investigative work. Your team’s role shifts from answering questions to acting on insights. Instead of “can you figure out why churn increased,” conversations become “churn increased because of X, Y, and Z, here’s what we’re going to do about it.”
Real Meetings That Don’t Suck
You know those painful weekly business reviews where everyone stares at reports and speculates about causes? Where half the meeting is people volunteering theories about what the data means?
Those meetings get dramatically shorter and more productive. Because you’re not starting from “the numbers changed”, you’re starting from “here’s exactly what drove the change, with statistical confidence levels, and here are the segments most affected.”
The conversation immediately jumps to strategy and action. Which is where it should have been all along.
The Technical Reality
I talk to a lot of companies who assume AI data analysis requires rebuilding their entire data infrastructure. It doesn’t.
Livedocs works with your existing data stack. You’re not migrating off your data warehouse or abandoning your current BI tools. You’re adding an intelligence layer on top of what you already have.
The platform connects through standard integrations, most implementations take a few hours, not months. You point it at your data sources, define your key metrics (which you’ve probably already defined in your BI tool), and it starts working.
The AI Isn’t Magic
Here’s what’s actually happening under the hood. Livedocs uses machine learning models trained on patterns in business data. When it analyzes your metrics, it’s applying techniques like:
- Dimensional analysis to identify which segments are driving changes
- Anomaly detection to spot unusual patterns
- Correlation analysis to find relationships between variables
- Time series analysis to separate trends from noise
- Statistical testing to determine significance
But you don’t need to understand any of this. The system handles the technical complexity and presents results in natural language. It’s like having a car, you don’t need to understand internal combustion engines to drive effectively.
Making the Transition
So how do you actually move from traditional BI to AI data analysis? Realistically, you don’t make a sudden switch. Most companies adopt both approaches in parallel.
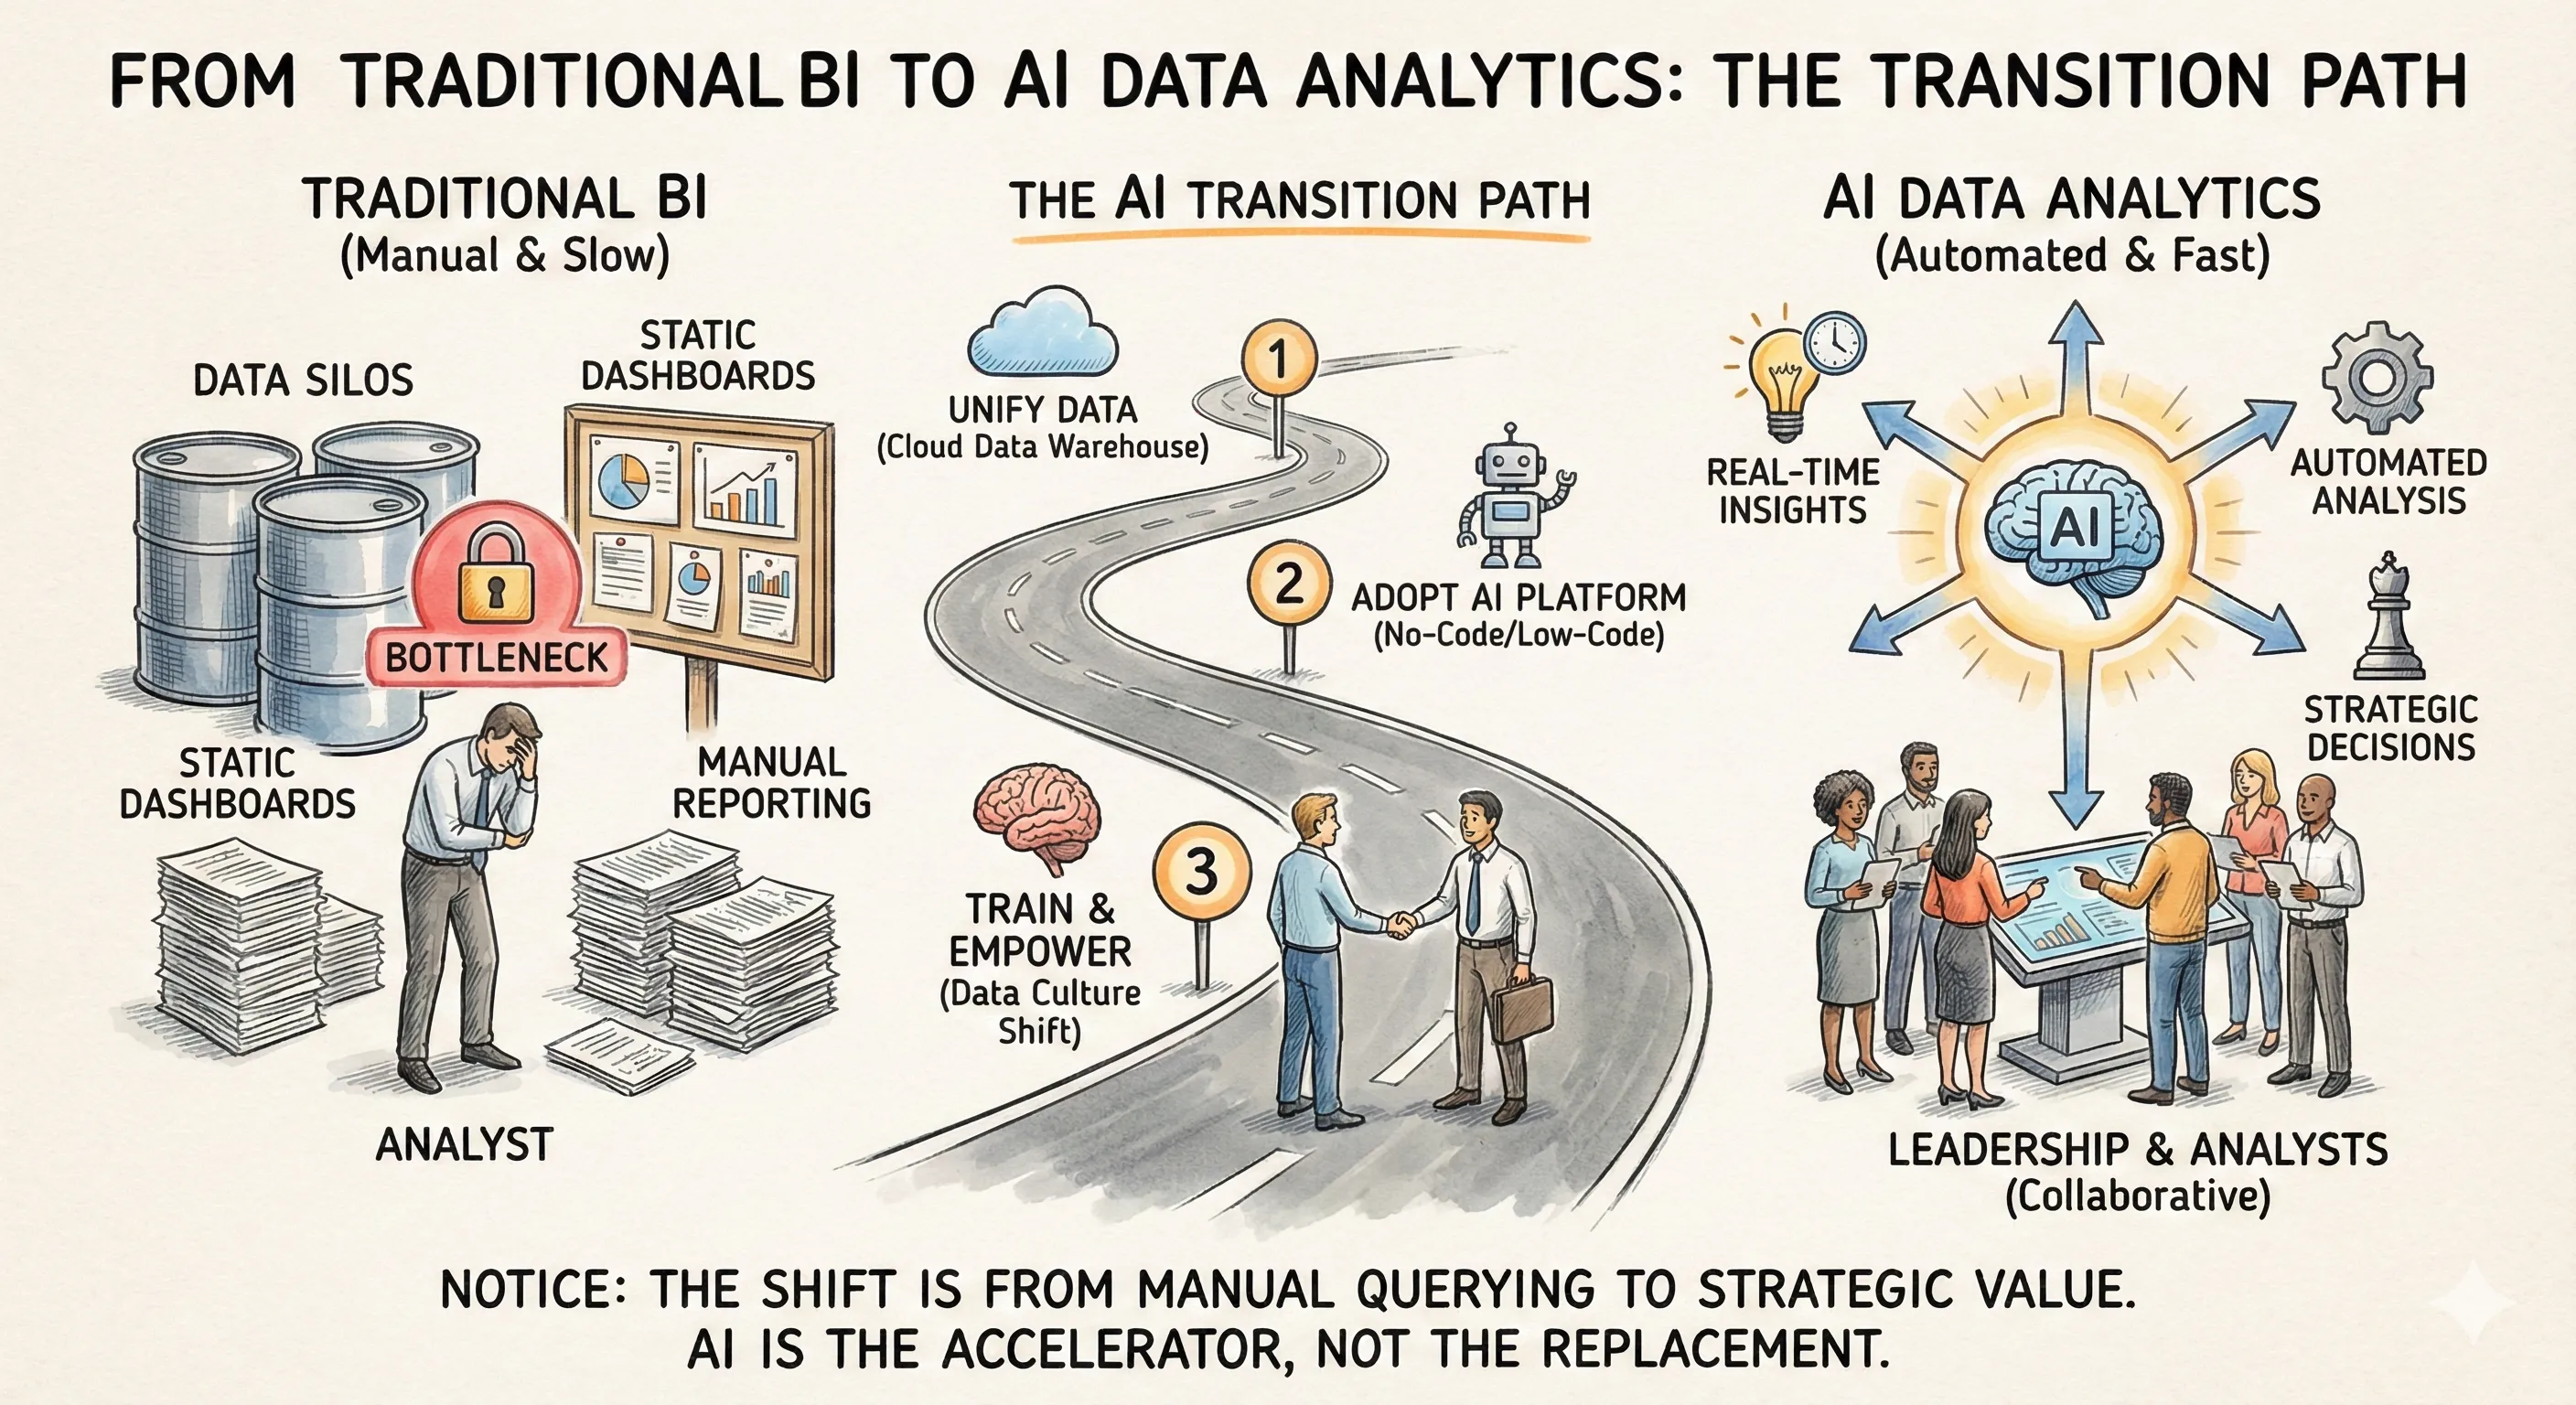
Keep your BI tools for reporting and visualization. Add AI analysis for investigation and insight generation. They serve different purposes and complement each other well.
Start with your most important business questions, the ones that currently require the most manual analysis. Set up AI monitoring for those metrics. See how it changes your understanding and decision speed. Then expand from there.
What Changes After Three Months
Companies that implement AI data analysis typically see these shifts:
Your analysts stop being human query engines and start focusing on strategic projects. Response time to business questions drops from days to minutes. Leadership gains confidence in decisions because they’re based on comprehensive analysis, not gut feeling. Problems get caught earlier because continuous monitoring spots trends before they become crises.
And here’s something nobody talks about, morale improves. Because your data team stops spending their time on repetitive investigative work and starts doing analysis that actually matters. That’s motivating.
The Cost Conversation Nobody Wants to Have
Traditional BI tools are expensive. Enterprise licenses run tens of thousands annually. Implementation takes months. Maintenance requires dedicated resources. And you still need analysts to actually extract insights.
AI data analysis tools like Livedocs have a different cost structure. The software itself might have similar or even lower licensing costs. But the real savings come from reduced analyst hours and faster decision-making.
When your team spends 60% less time on ad-hoc investigations, that’s real money. When you catch revenue problems two weeks earlier because of continuous monitoring, that’s real value. When leadership makes better decisions because they have better information, that compounds over time. I’m not saying traditional BI is a waste of money, it’s not. But when you factor in the total cost of actually getting insights from your data, the economics shift pretty dramatically toward AI analysis.
Where This Is All Heading
Look, BI tools aren’t going away. You’ll still need dashboards and reports. But the idea that humans should manually investigate every business question? That’s becoming obsolete.
AI data analysis isn’t the future, it’s the present. The companies adopting it now are moving faster, making better decisions, and getting more value from their data. The ones waiting are falling behind, whether they realize it yet or not.
Livedocs represents where this category is heading: automated investigation, natural language insights, continuous monitoring, and analysis that actually answers “why” instead of just showing “what.”
Final Thoughts
The question isn’t whether AI will change how we do business intelligence. It already has. The question is whether you’re ready to stop manually analyzing data and start letting AI do what it’s genuinely better at, comprehensive, continuous, statistical analysis, while you focus on what humans are better at: judgment, strategy, and action.
Because honestly? Life’s too short to spend three days answering a question that software can answer in three seconds.
Your data team will thank you. Your leadership will thank you. And you’ll wonder why you spent so many years staring at dashboards trying to guess what the numbers meant when you could have just asked the AI and gotten a real answer.
That’s the difference between traditional BI and AI data analysis. One shows you data. The other tells you what it means and what to do about it.
The best, fastest agentic notebook 2026? Livedocs.
- 8x speed response
- Ask agent to find datasets for you
- Set system rules for agent
- Collaborate
- And more
Get started with Livedocs and build your first live notebook in minutes.
- 💬 If you have questions or feedback, please email directly at a[at]livedocs[dot]com
- 📣 Take Livedocs for a spin over at livedocs.com/start. Livedocs has a great free plan, with $10 per month of LLM usage on every plan
- 🤝 Say hello to the team on X and LinkedIn
Stay tuned for the next article!
Ready to analyze your data?
Upload your CSV, spreadsheet, or connect to a database. Get charts, metrics, and clear explanations in minutes.
No signup required — start analyzing instantly

