Best Low-Code Tools for Data Visualization
Let’s be real. You’re brilliant at your job: marketing, operations, sales—but you didn’t sign up to be a full-time data engineer.
Yet here you are, staring at a spreadsheet, trying to remember how to build a pivot chart. It’s frustrating, and honestly, it’s a massive drain on your time.
The game has changed. The no-code revolution has matured, and today’s tools are so intuitive they feel like magic.
They’re built to bridge the gap between your questions and the answers hidden in your data, without requiring a technical degree.
Let’s explore the landscape, with a special focus on why a tool like Livedocs is redefining what’s possible.
Why Your Team Needs No-Code Data Tools Now
The argument is no longer about convenience; it’s about velocity. No-code tools provide:
-Instant Accessibility: Anyone on your team can become a data analyst.
-Blazing Speed: Go from question to chart in minutes, not days.
-Single Source of Truth: Connect directly to live data sources for always-current reports.
-Democratized Innovation: Empower your subject matter experts to find and share insights without bottlenecks.
This is about turning your entire organization into a data-driven powerhouse.
The Top Contenders in the No-Code Arena
1. For Drag-and-Drop Dashboarding: Tableau
The industry titan. Perfect for building incredibly complex, interactive dashboards once you’ve climbed its learning curve.
2. For the Microsoft Ecosystem: Power BI
Deeply integrated with the Microsoft stack. If your company runs on Azure and Office, this is your natural habitat.
3. For Google Users: Looker Studio
The free, accessible champion for marketers. It connects seamlessly to Google Analytics, Sheets, and Ads for quick, shareable reports.
4. For AI-Powered Simplicity: Livedocs
While other tools require you to learn their interface, Livedocs learns from you. It represents the next evolutionary step in no-code analysis by combining visual automation with conversational AI.
Why Livedocs is Revolutionizing No-Code Analysis
Livedocs stands apart by making the process of data visualization as simple as having a conversation. It’s built on two groundbreaking principles:
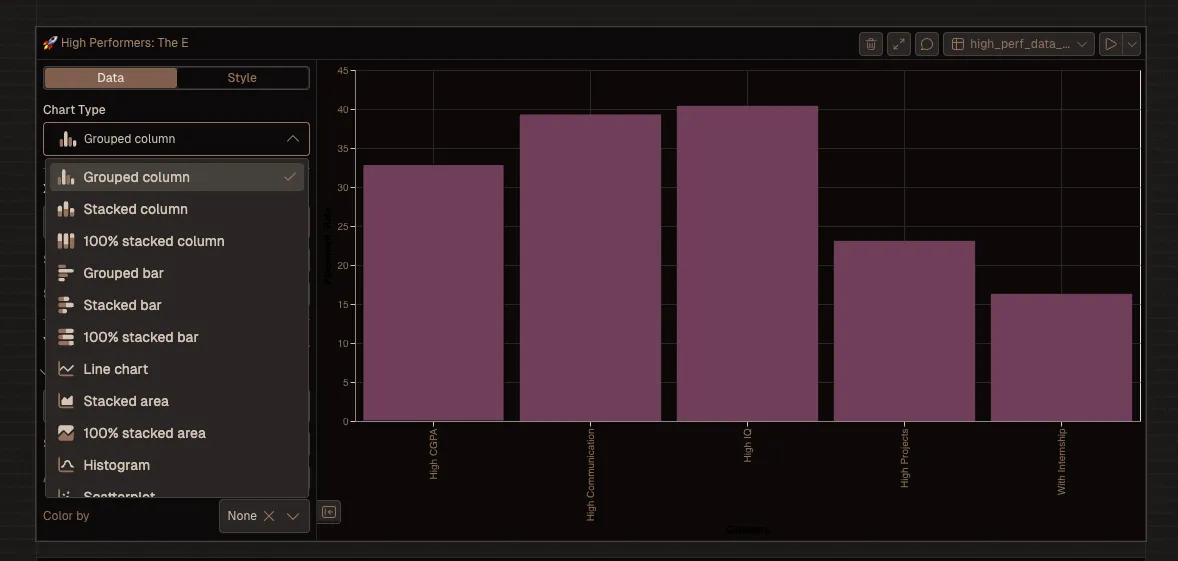
1. The Interactive Chart Creator: See Your Changes Instantly
Forget complex configuration panels.
Livedocs features a fluid, interactive canvas where you can manipulate your data visually.
Drag to filter, click to group categories, and watch as your charts update in real-time. It’s an intuitive, hands-on way to explore your data without any fear of “breaking” something.
2. Just Ask the AI to Create It
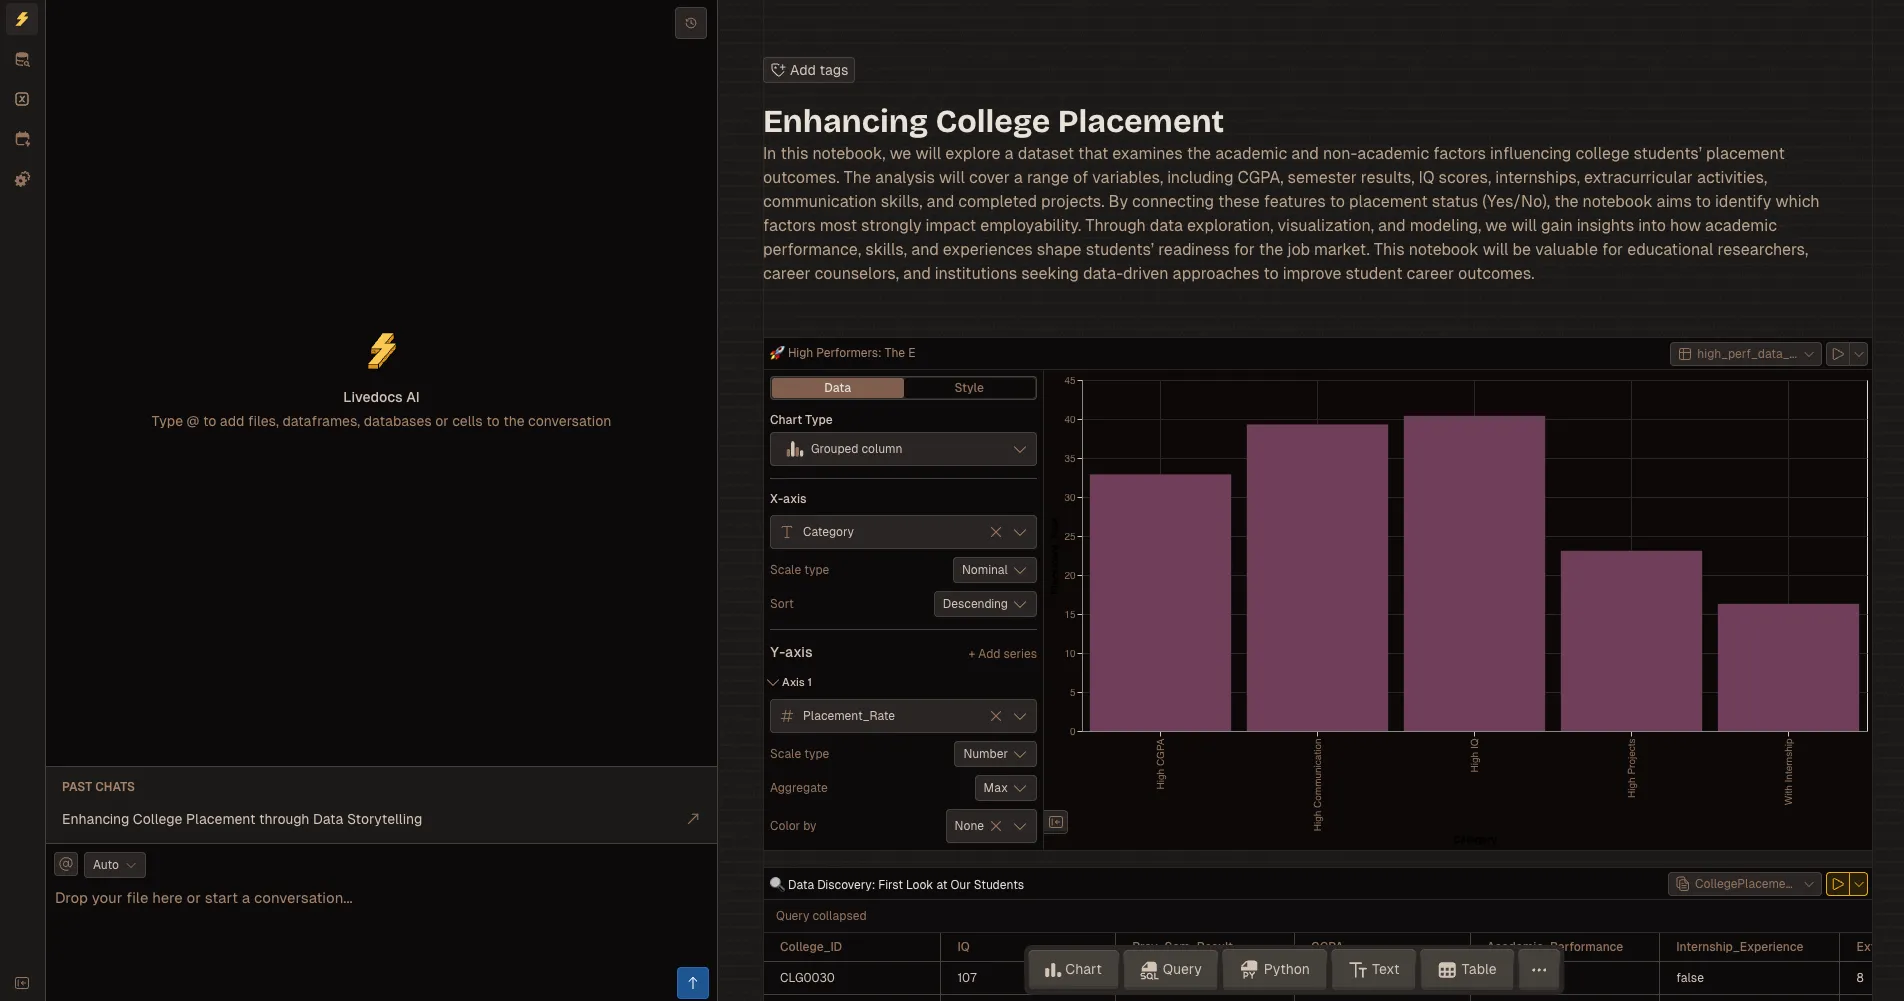
This is the true game-changer. Imagine you need a “bar chart showing sales by region for the last quarter.”
In a traditional tool, you’d need to drag the ‘Sales’ field, find the ‘Region’ field, set the date filter, and choose the chart type.
In Livedocs, you just type that exact request. The built-in AI interprets your natural language command, understands your data’s structure, and instantly generates the precise chart you asked for.
In Livedocs, you just type that exact request.
This combination of interactive editing and AI-driven creation makes Livedocs uniquely powerful:
Zero Learning Curve: You don’t need to know chart types or data fields. You just ask for what you want.
Iterative Exploration: See a trend? Just ask the AI, “Now show me that as a line chart over time.” The conversation with your data is fluid and dynamic.
Automated Data Wrangling: Behind the scenes, the AI handles the data cleaning and transformation, ensuring your charts are built from accurate, prepared data.
Final Thoughts
The era of struggling with software is over. Whether you choose the dashboarding power of Tableau, the integrated familiarity of Power BI, or the AI-powered simplicity of Livedocs, the power to visualize and analyze is at your fingertips.
The best tool is the one that gets out of your way and lets you focus on what matters—finding the story in your data. With platforms where you can simply ask an AI to create your chart, that future is already here. Why not start your conversation with data today?
The best, fastest agentic notebook 2026? Livedocs.
- 8x speed response
- Ask agent to find datasets for you
- Set system rules for agent
- Collaborate
- And more
Get started with Livedocs and build your first live notebook in minutes.
- 💬 If you have questions or feedback, please email directly at a[at]livedocs[dot]com
- 📣 Take Livedocs for a spin over at livedocs.com/start. Livedocs has a great free plan, with $10 per month of LLM usage on every plan
- 🤝 Say hello to the team on X and LinkedIn
Stay tuned for the next tutorial!
Ready to analyze your data?
Upload your CSV, spreadsheet, or connect to a database. Get charts, metrics, and clear explanations in minutes.
No signup required — start analyzing instantly

