Jupyter vs. BI Tools: When to Use Which?
Every data-driven team I’ve worked with faces the same awkward conversation at some point.
It usually goes something like this: “Should we build this analysis in Jupyter or just throw it into Tableau?” And honestly, depends. Sometimes Jupyter is great for this project, but BI tools are better for the others.
Let me walk you through this classic dilemma, and maybe save you from a few headaches along the way.
—
The Jupyter Notebook Approach
Here’s where Jupyter shines: exploratory data analysis. When you’re not quite sure what story your data tells, notebooks let you poke around, test hypotheses, and follow interesting tangents.
You can clean messy data exactly how you want, run sophisticated statistical models, and create those one-off analyses that would be impossible in most BI tools.
I’ve seen data scientists build incredible predictive models in Jupyter, stuff that would make your head spin. Customer churn predictions, fraud detection algorithms, market basket analyses. The flexibility is genuinely impressive.
🚨 But here’s the thing: that flexibility comes with baggage. Jupyter notebooks live in a technical bubble. Your marketing manager can’t easily interact with your analysis. Your CEO definitely isn’t going to fire up Python to understand quarterly trends. And don’t get me started on version control, trying to collaborate on notebooks can feel like herding cats.
—
BI Tools, The Enterprise Solution
BI Tools are different.
They’re built for consumption, not creation. Your entire organization can access dashboards, filter data, and get insights without writing a single line of code.
These tools excel at what I call “operational intelligence”, monitoring KPIs, tracking performance against goals, and creating those executive dashboards that make board meetings run smoothly. They’re fantastic for standardized reporting and giving non-technical teams the power to explore data independently.
The setup process, though? That’s where things get interesting (and by interesting, I mean potentially frustrating).
You’ll need someone who understands both your business logic and the tool’s quirks. Data modeling can become a full-time job. And if you want to add a new data source or change how something’s calculated, you’re often looking at weeks of work.
🚨 Here’s what really gets me: most BI tools treat every analysis like it needs to be a permanent dashboard. Sometimes you just want to quickly test an idea or run a what-if scenario. But you end up building entire data pipelines for questions that might not even matter next week.
—
The Problem Neither Tool Solves Well
But here’s where it gets frustrating.
🚧 Most teams end up needing both approaches, which creates this weird split-brain situation.
🚧 Your technical folks work in notebooks, building amazing analyses that never see the light of day.
🚧 Meanwhile, your business teams rely on dashboards that can’t adapt quickly to new questions.
You end up with analysts constantly translating between worlds, taking insights from notebooks and rebuilding them in BI tools, or trying to explain why that “simple” dashboard change actually requires three weeks of development work.
This gap between exploration and communication has been driving teams crazy for years. The technical depth you need for good analysis doesn’t play nicely with the accessibility required for business consumption.
Enter the Bridge Solution
This is exactly why tools like Livedocs are gaining traction.
Instead of forcing you to choose between flexibility and accessibility, Livedocs designed to bridge that gap. Think of Livedocs as bringing live data directly into documents that anyone can understand and interact with.
You can pull real-time data from your existing tools, whether that’s Stripe, Google Analytics, your data warehouse, or whatever else you’re using, without the typical setup headaches.
What makes this approach compelling is how it handles the collaboration problem. Your data work stays connected to your business context. Instead of having insights locked away in technical notebooks or buried in dashboard folders, your analysis lives where your team actually works and makes decisions.
No building permanent dashboards or writing complex code, you can create interactive documents that answer specific business questions and share them immediately.
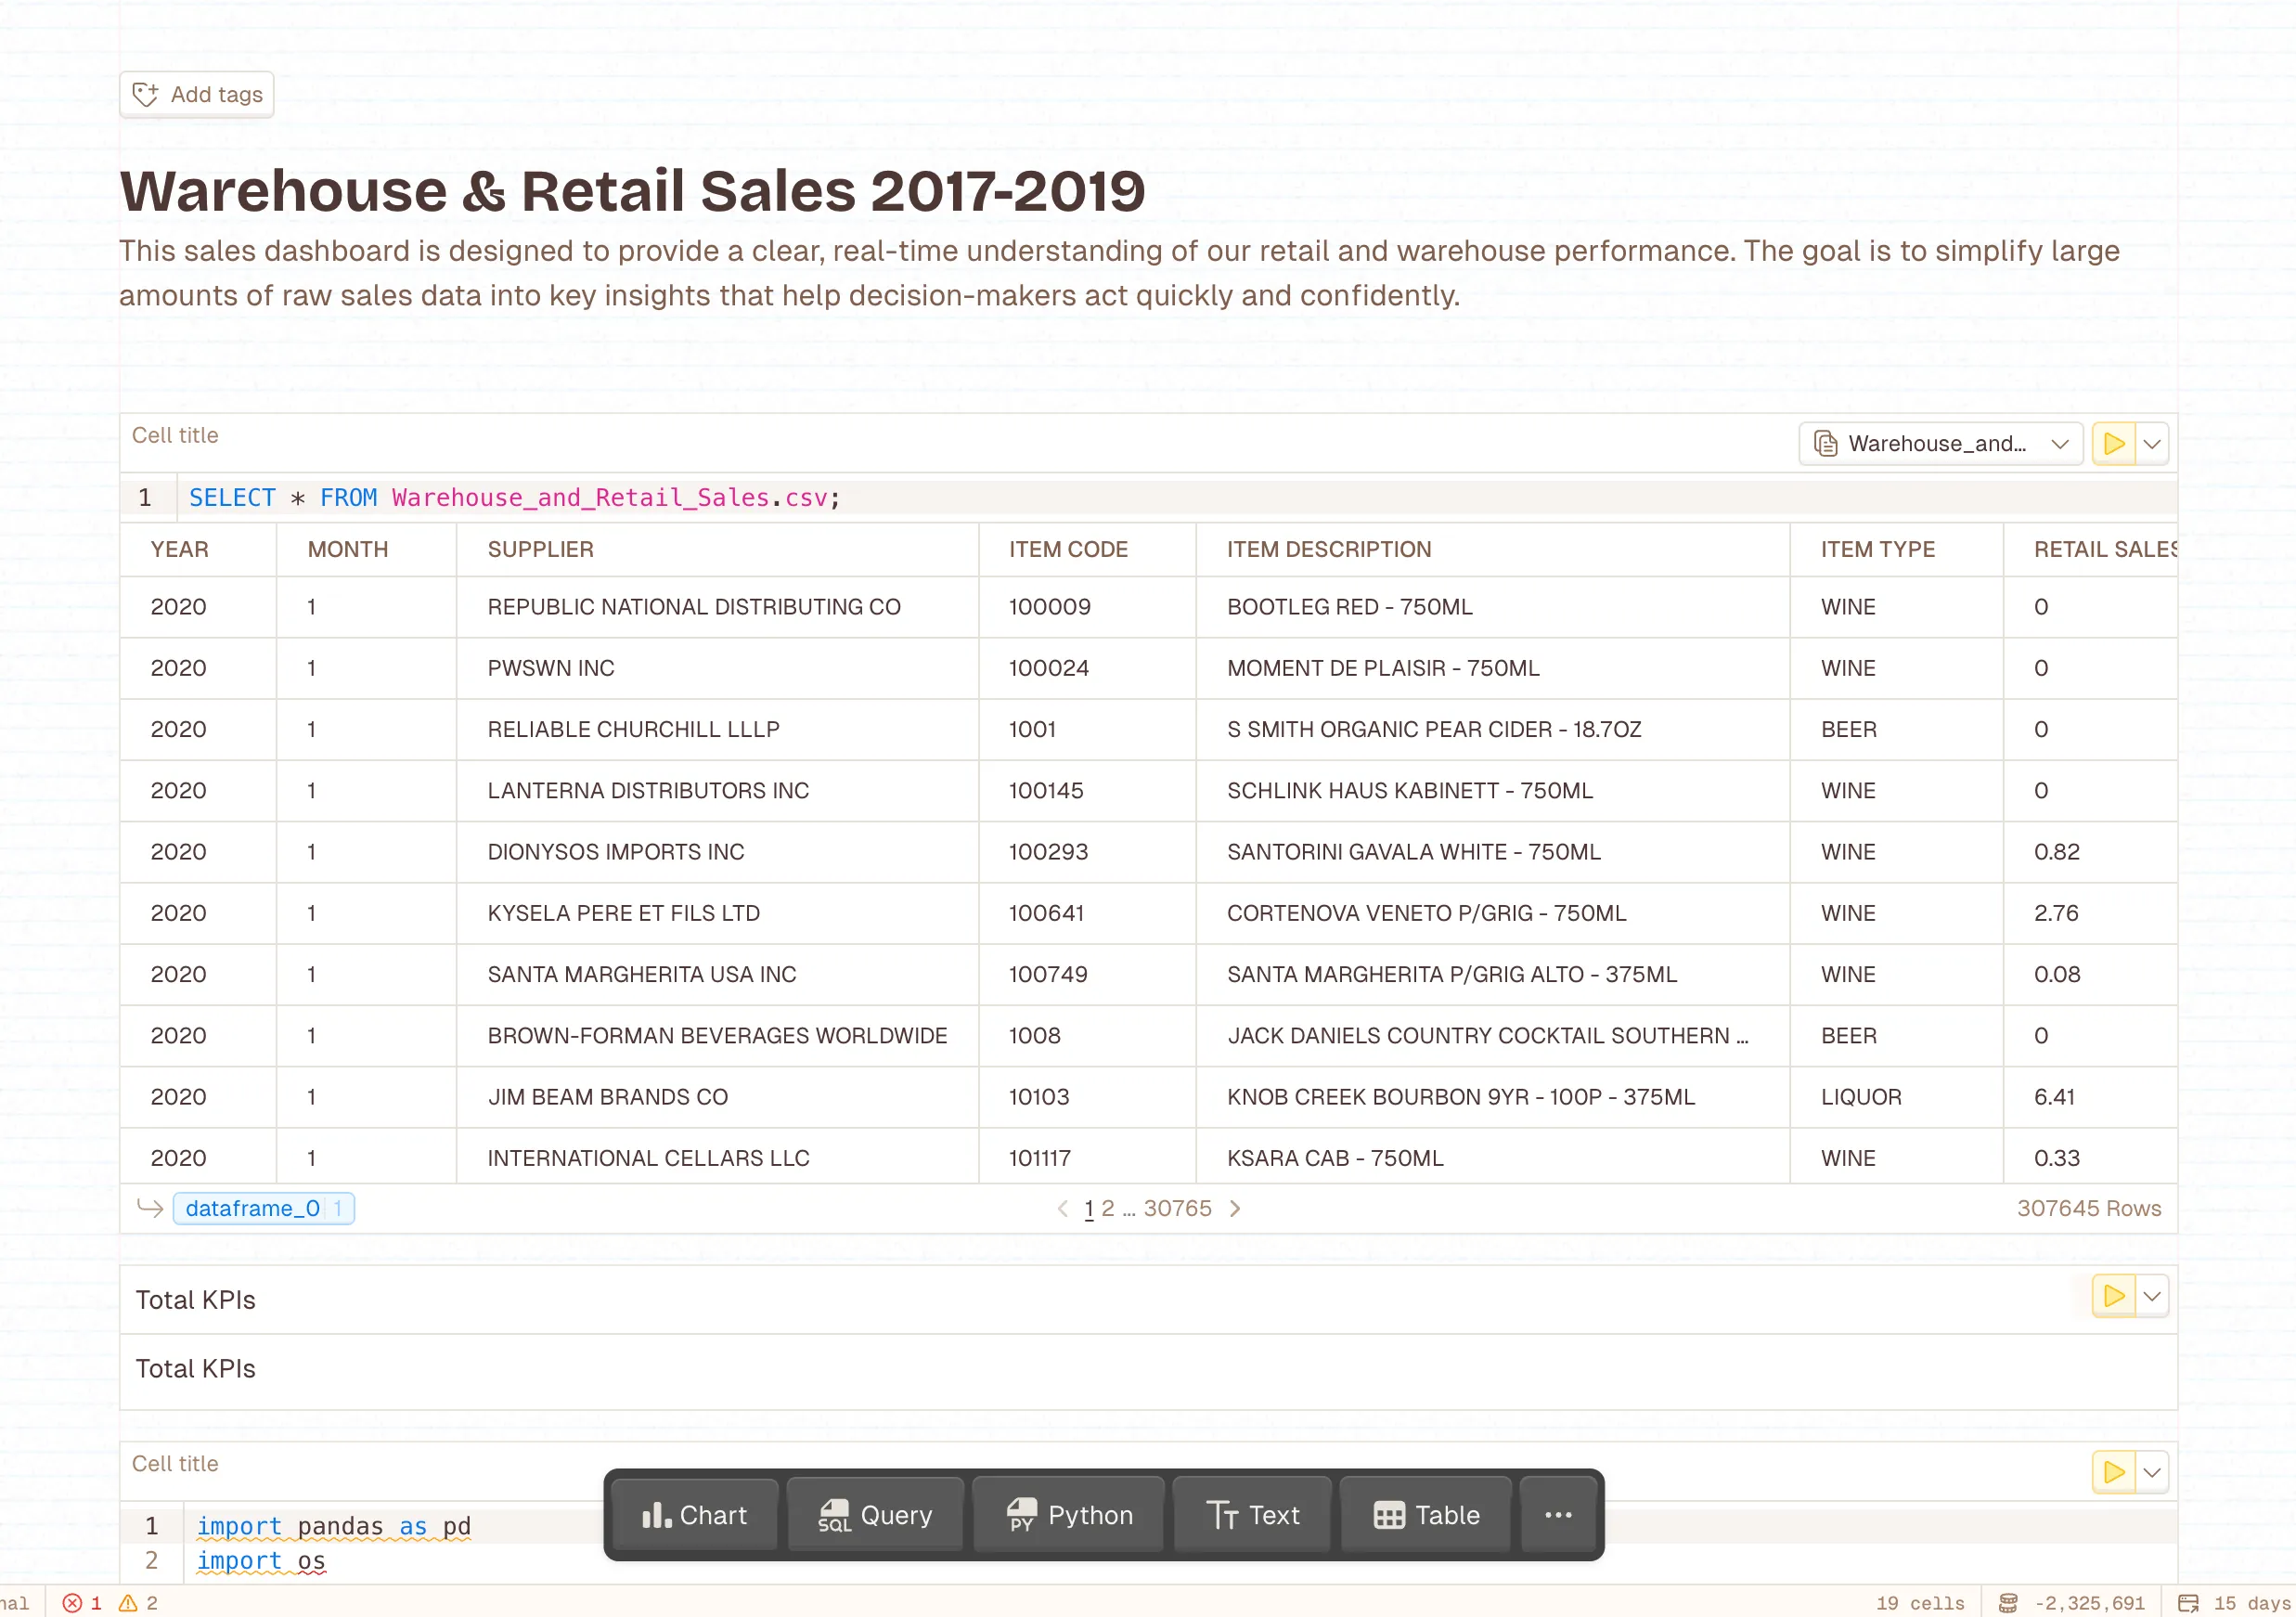
Features only available on Livedocs, crete charts, write Python or SQL for advanced features, build tables, or even insert AI agent, prompts.
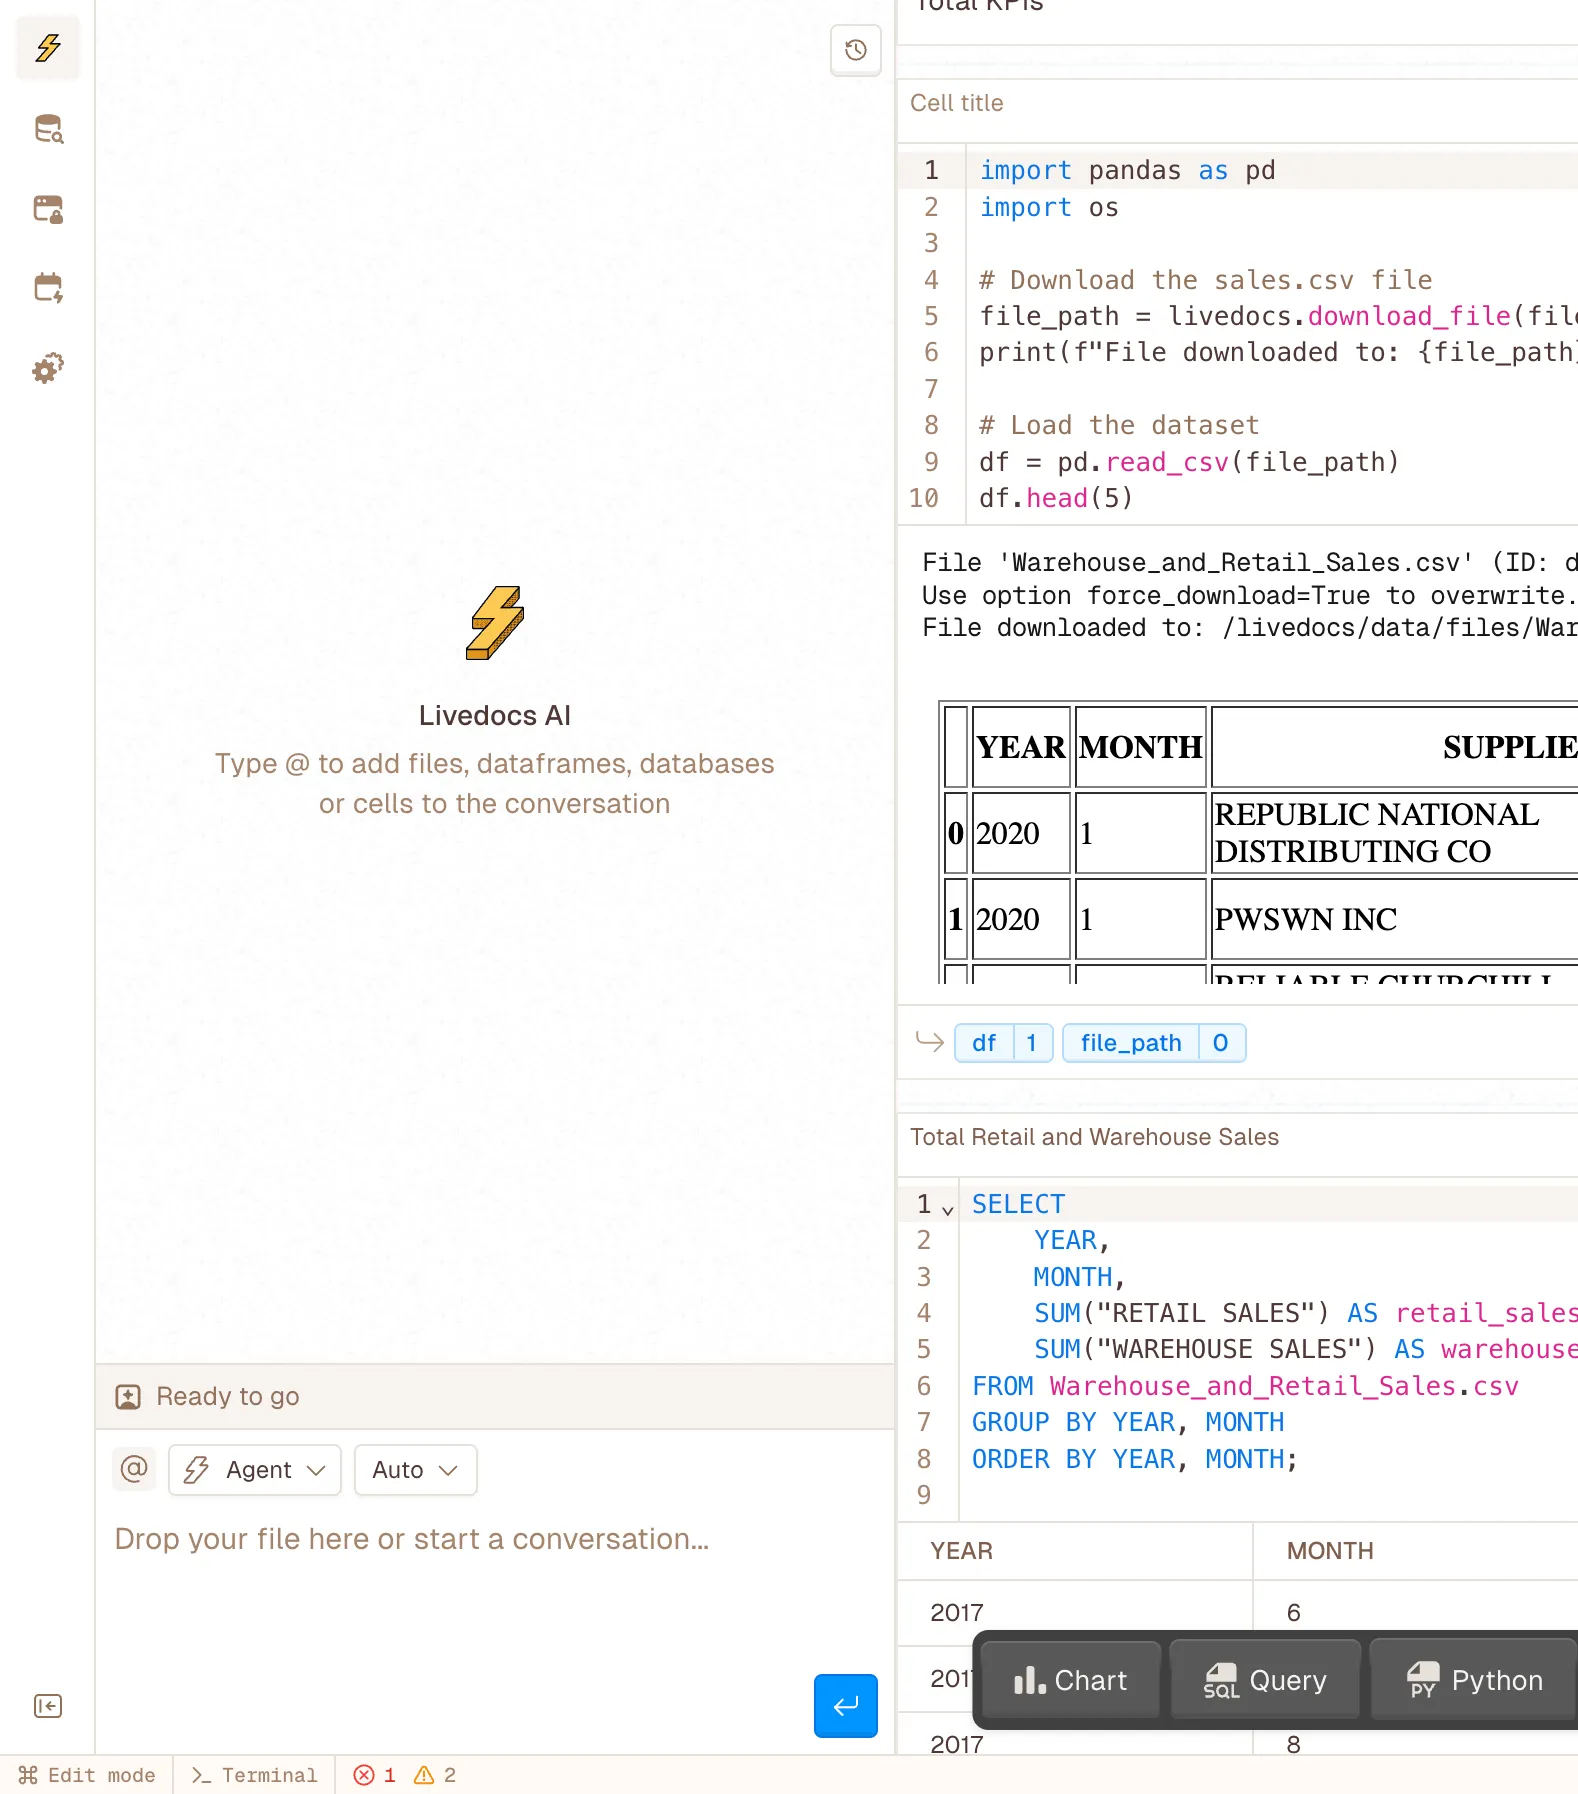
Integrated with our AI Agent to help you with any data tasks, ask the agent about the recent sales forecasts for your data, what columns are required for your data, or even ask it to build the dashboard.
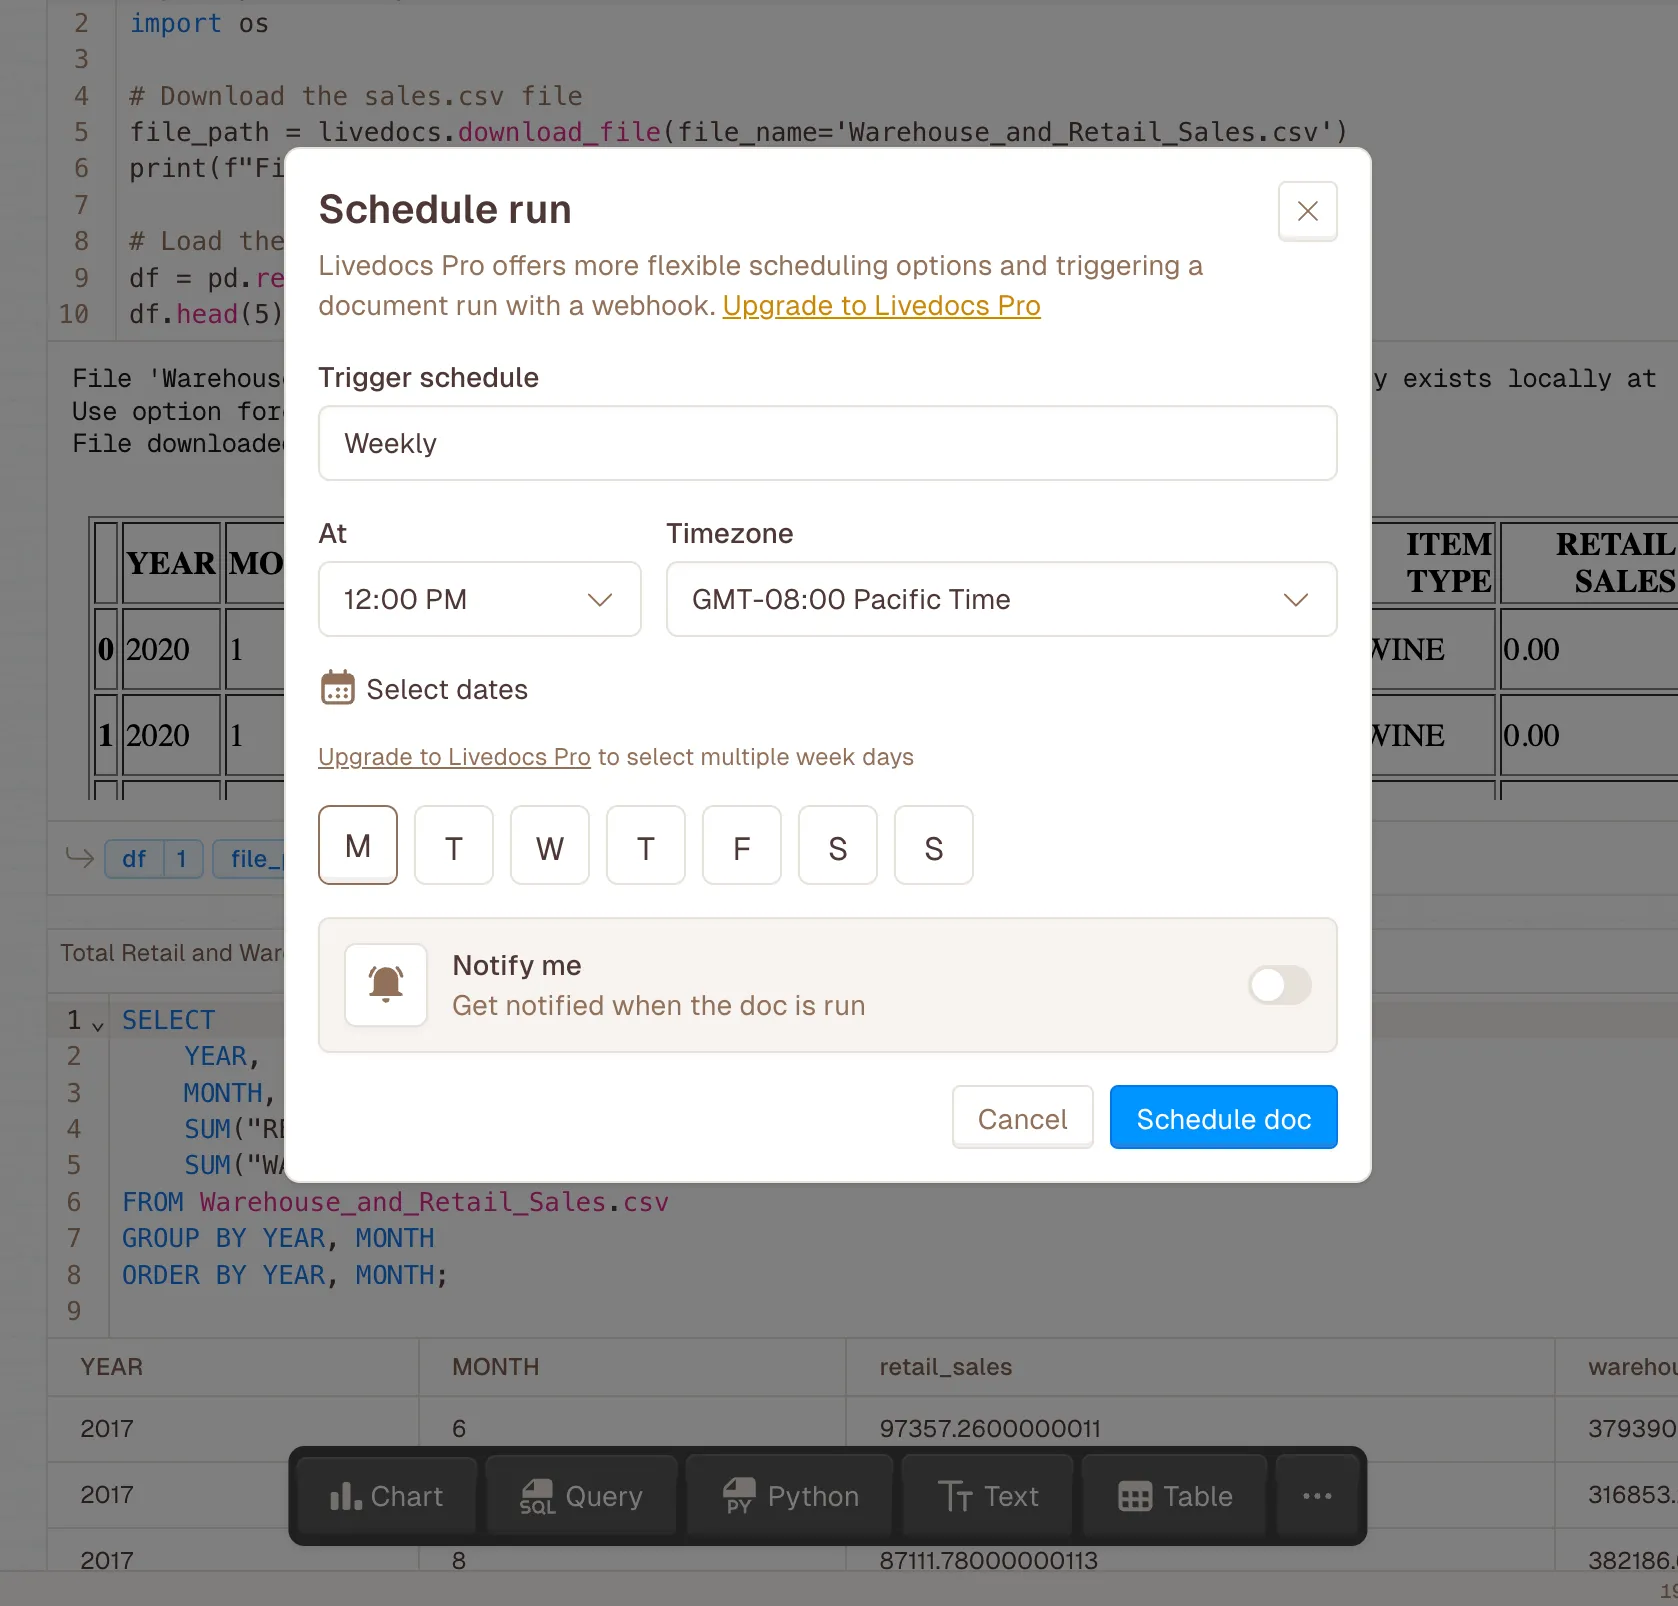
No one does this, Livedocs Pro offers more flexible scheduling options and triggering a document run with a webhook. For example running a specific job at a certain date or time?
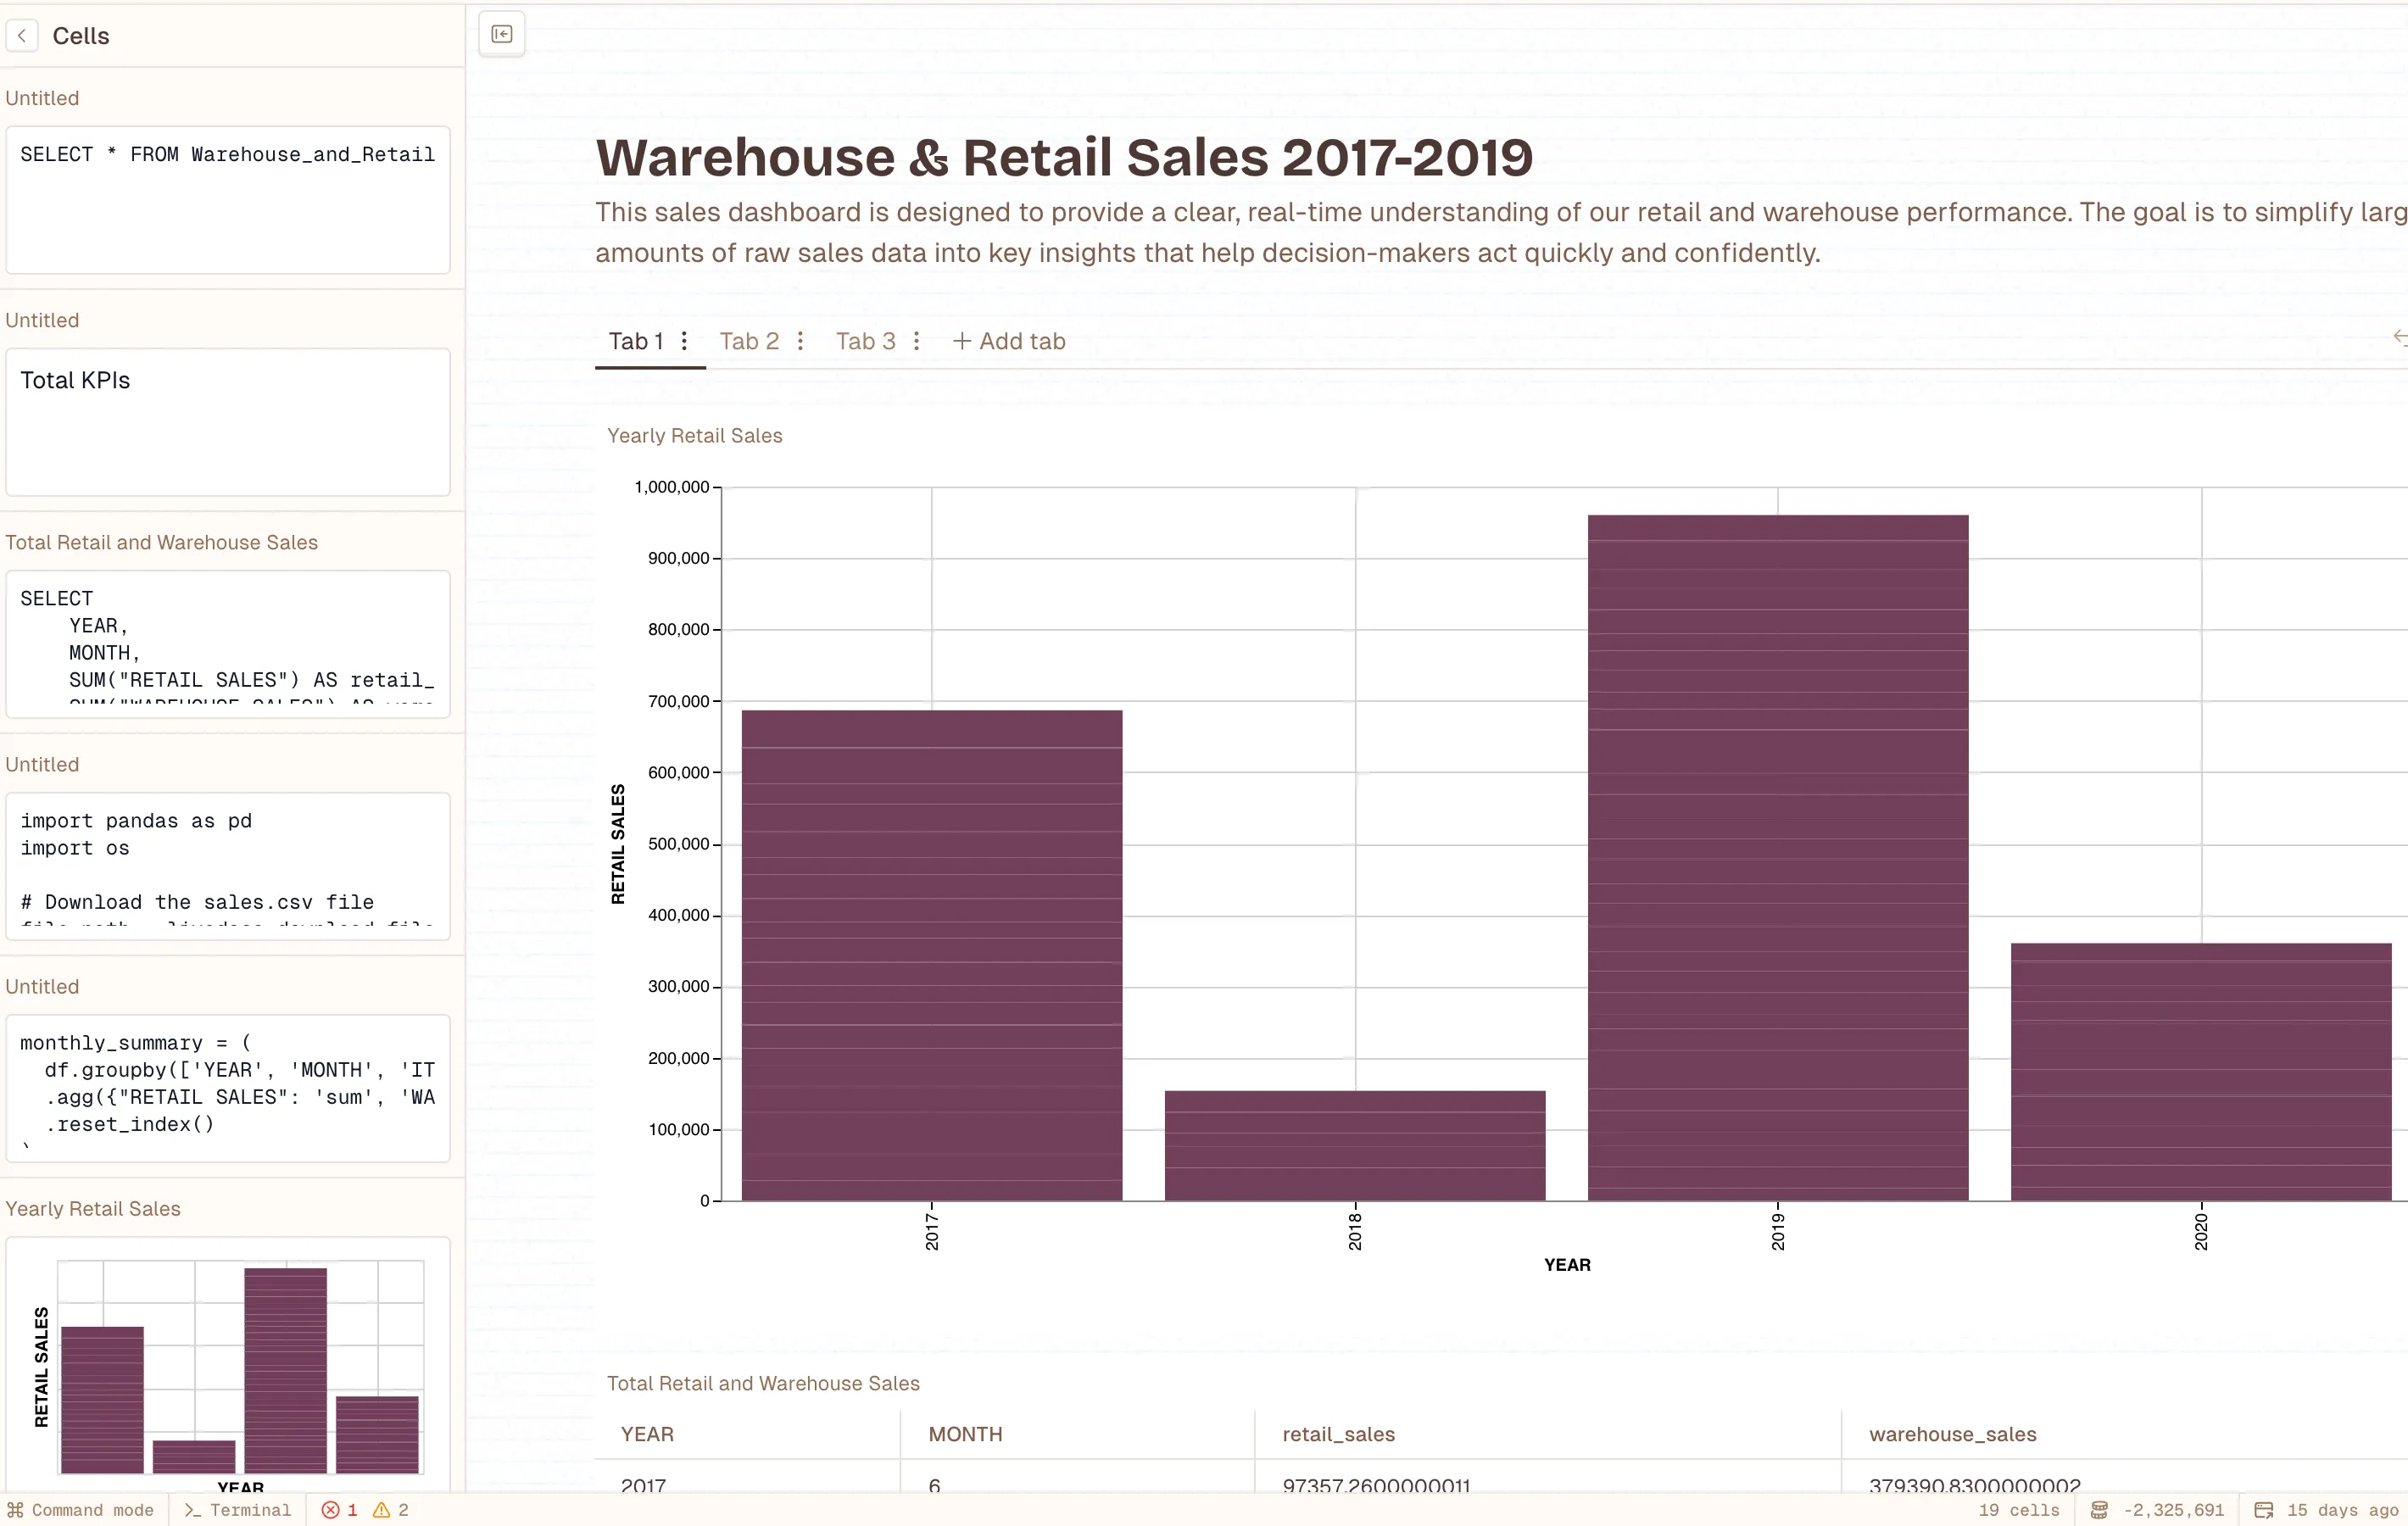
Finally, present your finding with our special drag and drop app feature 🎉! Data will be presented live and your team or customers will never miss any updates again.
—
Making the Right Choice for Your Team
So how do you decide? Start by asking yourself a few key questions:
- Who needs to see this analysis? If it’s just your data team, notebooks might be fine. If it needs to reach executives or cross-functional partners, you need something more accessible.
- How often will this analysis run? One-time resgearch projects work great in notebooks. Recurring reports need more structured solutions.
- What’s your team’s technical comfort level? Be honest about this one. Just because someone can open a notebook doesn’t mean they should be maintaining production analyses in Python.
- How quickly do you need to iterate? If you’re in rapid experimentation mode, the overhead of traditional BI tools can slow you down significantly.
- What’s your data infrastructure like? Complex data transformations might require the full power of notebooks, while clean, structured data works well with most BI platforms.
—
Final Thoughts
The Jupyter vs. BI tools debate isn’t really about picking a winner.
Your data work shouldn’t feel like you’re constantly translating between two different worlds. Livedocs helps your entire team stay connected to insights, iterate quickly on new questions, and turn analysis into action without getting lost in technical complexity.
The fastest way to build a live dashboard in 2026? Livedocs.
- Instant data connections
- Drag-and-drop editor
- Real-time updates
- Easy sharing
Get started with Livedocs and build your first live dashboard in minutes.
—
- 💬 If you have questions or feedback, please email directly at a[at]livedocs[dot]com
- 📣 Take Livedocs for a spin over at livedocs.com/start. Livedocs has a great free plan, with $10 per month of LLM usage on every plan
- 🤝 Say hello to the team on X and LinkedIn
Stay tuned for the next tutorial!
Ready to analyze your data?
Upload your CSV, spreadsheet, or connect to a database. Get charts, metrics, and clear explanations in minutes.
No signup required — start analyzing instantly

