Complete DuckDB Tutorial For Beginners
There’s this moment every data analyst has experienced. You’re working with a 5GB CSV file, pandas is eating up all your RAM, and you’re are thinking “there has to be a better way.”
You’ve tried loading it into PostgreSQL, but setting up a database server for a one-off analysis feels like overkill. You just want to run some SQL queries without all the ceremony.
I’ve been using DuckDB for about a year now, and it’s completely changed how I approach data analysis. Let me show you why it’s become my go-to tool, and how using it in Livedocs makes everything even better.
![]()
What Exactly Is DuckDB?
DuckDB is an in-process analytical database that runs SQL queries blazingly fast without needing a server. Kind of similar to SQLite, it’s embedded right in your Python or R environment, but it’s specifically built for analytics work.
When we say “analytical,” we mean OLAP workloads, complex queries that aggregate, join, and transform data. The stuff that makes pandas sweat and traditional databases charge you a fortune for. DuckDB handles this natively, using columnar storage and vectorized execution.
The best part? It’s completely free and open source under the MIT license. The creators were Dutch public servants who believed their work should benefit everyone. They literally said they’re resisting venture capital because they want to keep DuckDB accessible. That’s pretty refreshing in today’s tech landscape.
Why DuckDB Beats Your Current Setup
Let’s be honest about what we’re usually doing for data analysis. Most people reach for pandas first. And pandas is great, I love pandas, but it has limits. Once your dataset exceeds your RAM, you’re in trouble. Operations get slow, you start getting memory errors, and you’re back to sampling your data just to make it manageable.
Or maybe you’re using a proper database like PostgreSQL. That works, but you need to set up a server, manage connections, transfer data back and forth, and suddenly you’re spending more time on infrastructure than analysis.
DuckDB sits in this sweet spot where you get:
- SQL queries that are familiar and powerful
- Speed that rivals specialized analytics databases
- Zero setup because it runs in your process
- Direct integration with pandas, Polars, and Arrow
- File format support for CSV, JSON, Parquet, you name it
It can query files directly without loading them into memory first. Got a 50GB Parquet file? DuckDB can run queries on it right from disk or even directly from S3. No importing, no waiting.
Getting Started: The Absolute Basics
Installing DuckDB is ridiculously simple. If you’re using Python (which I’ll assume for this tutorial), it’s just:
pip install duckdb
That’s it. No configuration files, no services to start, no permissions to set up. You’re ready to go.
Let’s start with something simple. Here’s how you’d query a CSV file:
import duckdb

# Query a CSV file directly - no loading required
result = duckdb.query("""
    SELECT
        product_name,
        SUM(sales_amount) as total_sales
    FROM 'sales_data.csv'
    GROUP BY product_name
    ORDER BY total_sales DESC
    LIMIT 10
""").df()

print(result)
Notice what we did there? We referenced the CSV file directly in the FROM clause. DuckDB reads it, understands the structure, and runs your query. The .df() at the end converts the result to a pandas DataFrame because sometimes you still need pandas for specific operations.
This is already way better than reading the entire CSV into pandas first, especially for large files.
Working with Parquet
This is where DuckDB really shines.
Parquet files are DuckDB’s best friend. They’re columnar, compressed, and perfect for analytical queries. If you’re still using CSV for everything, this might convince you to switch.
import duckdb

# Query a Parquet file
query = """
    SELECT
        DATE_TRUNC('month', order_date) as month,
        region,
        COUNT(*) as order_count,
        AVG(order_value) as avg_order_value
    FROM 'orders.parquet'
    WHERE order_date >= '2024-01-01'
    GROUP BY month, region
    ORDER BY month, region
"""

results = duckdb.sql(query).df()
This query runs in seconds on files that would take minutes to load into pandas. And if your Parquet file is sitting on S3? DuckDB can read it directly from there too:
# Install and load the httpfs extension
duckdb.sql("INSTALL httpfs")
duckdb.sql("LOAD httpfs")

# Query directly from S3
duckdb.sql("""
    SELECT *
    FROM 's3://your-bucket/data.parquet'
    LIMIT 10
""").show()
This is one of those features that sounds too good to be true until you actually use it. No downloading, no copying, just query the data where it lives.
The Connection Object
So far we’ve been using DuckDB’s quick query methods. But sometimes you want a persistent database that saves your work. That’s where the connection object comes in:
import duckdb

# Create a persistent database file
con = duckdb.connect('my_analysis.duckdb')

# Create a table from a CSV
con.execute("""
    CREATE TABLE sales AS
    SELECT * FROM 'sales_data.csv'
""")

# Now you can query it anytime
con.execute("SELECT COUNT(*) FROM sales").fetchall()

# Close when done
con.close()
The database gets saved to a single file, my_analysis.duckdb, that you can reopen later. This is perfect for analyses that span multiple sessions or when you’re preparing data that you’ll query repeatedly.
You can also use an in-memory database if you don’t need persistence:
con = duckdb.connect(':memory:')
In-memory databases are faster for temporary work and automatically disappear when your script ends.
Integrating with Pandas
Here’s where things get really interesting. DuckDB can query pandas DataFrames directly without copying data. This means you can combine the best of both worlds, use pandas for what it’s good at, and DuckDB for heavy lifting.
import pandas as pd
import duckdb

# Create a pandas DataFrame
customers = pd.read_csv('customers.csv')
orders = pd.read_csv('orders.csv')

# Query both DataFrames with SQL
result = duckdb.query("""
    SELECT
        c.customer_name,
        COUNT(o.order_id) as order_count,
        SUM(o.order_value) as total_spent
    FROM customers c
    LEFT JOIN orders o ON c.customer_id = o.customer_id
    GROUP BY c.customer_name
    HAVING order_count > 5
    ORDER BY total_spent DESC
""").df()

print(result)
See what happened? We’re referencing pandas DataFrames (customers and orders) directly in SQL. DuckDB automatically detects them and runs the query without any explicit registration or data copying.
This is huge for complex joins or aggregations that would be painful in pandas. Write SQL instead, get better performance, and still end up with a DataFrame at the end.
Using DuckDB in Livedocs
Okay, so DuckDB is great for local analysis. But here’s where Livedocss takes it to another level. LiveDocs is a collaborative data workspace that combines SQL, Python, visualizations, and documentation in one place. When you use DuckDB in Livedocs, you get all the benefits of DuckDB plus:
- Shared environments where your team can run the same queries
- Version control for your analysis
- Interactive dashboards built on your DuckDB queries
- Real-time collaboration on data exploration
- Computing resources that aren’t limited by your laptop
But here’s the really cool part: Livedocs has native MotherDuck integration.
MotherDuck: DuckDB’s Cloud-Powered Sibling
You know how I said DuckDB is great for local analysis? Well, MotherDuck is what happens when you take DuckDB and supercharge it with cloud capabilities. It’s a serverless analytics platform built specifically around DuckDB, created in partnership with DuckDB Labs themselves.
Think of it like this: DuckDB is your local analysis tool, and MotherDuck extends it to the cloud without changing how you work. The magic is in what they call “Dual Execution” (formerly hybrid execution), your queries can run partly on your laptop and partly in the cloud, automatically optimized for where the data lives.
Here’s what that means in practice:
# Connect to MotherDuck from DuckDB - it's literally one line
import duckdb

con = duckdb.connect('md:')  # That's it. You're now connected to MotherDuck.

# Now you can query both local and cloud data in the same query
result = con.execute("""
    SELECT
        l.customer_id,
        l.local_transactions,
        c.cloud_transactions
    FROM local_data.db l
    JOIN md:my_database.cloud_data c
    ON l.customer_id = c.customer_id
""").df()
MotherDuck automatically figures out which part of the query should run where. If you’re joining local data with cloud data, it’ll execute each part optimally and merge the results. You don’t have to think about it, it just works.
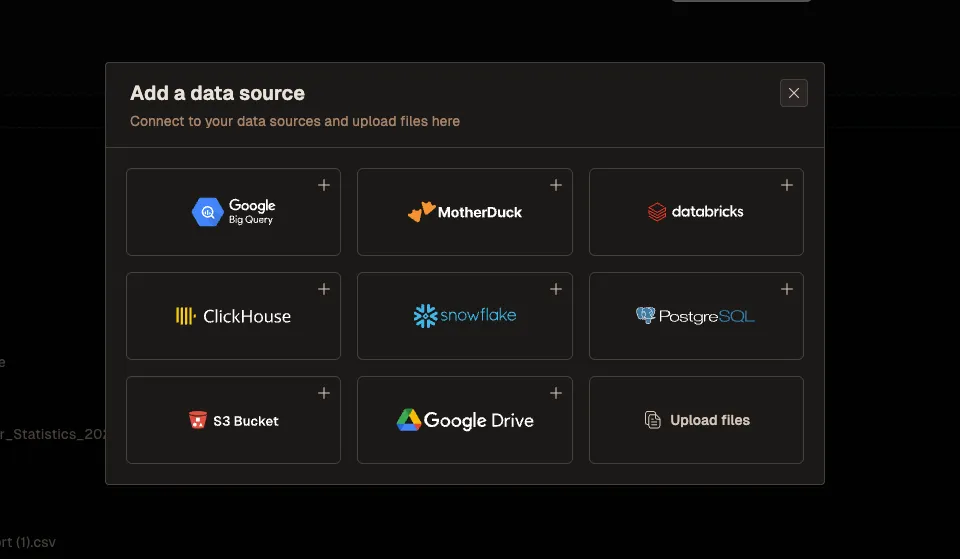
Or you can simply connect it with Livedocs on the platform:
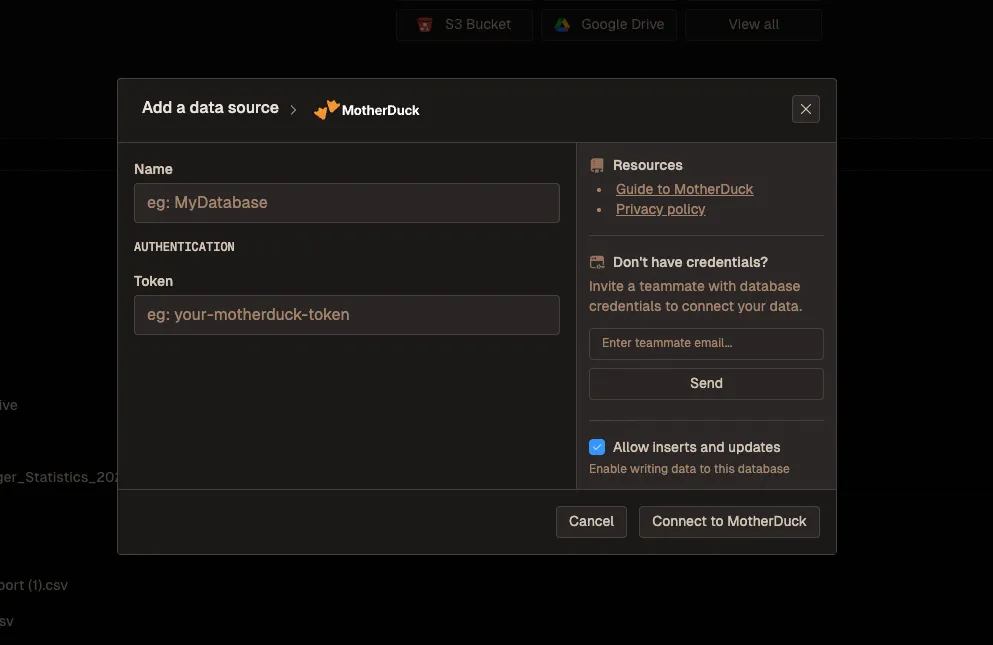
First pick a data source, which is MotherDuck:
And add your authentication details:
Why MotherDuck + Livedocs Is a Game Changer
In Livedocs, the MotherDuck integration means you get the best of three worlds:
-
DuckDB’s Speed and Simplicity You’re still writing the same DuckDB SQL you know and love. No new syntax to learn.
-
MotherDuck’s Cloud Scale When your data gets bigger than your laptop can handle, MotherDuck takes over. You can query multi-gigabyte datasets stored in the cloud without downloading anything.
-
Livedocs’ Collaboration Features Your entire team can access the same MotherDuck databases through Livedocs, running queries collaboratively in real-time.
# In LiveDocs with MotherDuck integration
import duckdb

# Connect to MotherDuck (credentials managed by LiveDocs)
con = duckdb.connect('md:')

# Your data lives in MotherDuck's cloud storage
con.execute("""
    CREATE TABLE IF NOT EXISTS md:analytics.products AS
    SELECT * FROM 's3://company-bucket/products.parquet'
""")

# Run analysis - MotherDuck handles the heavy lifting
analysis = con.execute("""
    SELECT
        p.category,
        DATE_TRUNC('month', s.sale_date) as month,
        SUM(s.quantity * p.price) as revenue
    FROM md:analytics.sales s
    JOIN md:analytics.products p ON s.product_id = p.product_id
    WHERE s.sale_date >= CURRENT_DATE - INTERVAL 90 DAY
    GROUP BY p.category, month
    ORDER BY month, category
""").df()

# Results appear instantly in LiveDocs
The beauty is that your teammates can open this same Livedocs document and run the same queries against the same MotherDuck database. No setting up their own DuckDB instance, no downloading data files, no version control nightmares with different people having different datasets.
Sharing and Collaboration with MotherDuck
One of MotherDuck’s killer features is database sharing. You can share entire databases with teammates through a simple command:
# Create a shareable database
con.execute("CREATE SHARE my_analysis_share FROM my_database")
# Returns a URL that others can use
In Livedocs, this becomes even more powerful. You can create an analysis document that references a MotherDuck database, share that document with your team, and everyone immediately has access to both the queries and the underlying data. No emailing CSV files, no Dropbox links, no “which version is the latest?” confusion.
When someone on your team needs to add their own analysis, they just fork the Livedocs document or add their own queries. MotherDuck ensures everyone’s looking at the same source data, while Livedocs ensures everyone can see each other’s work.
In Livedocs, you can add parameter inputs that let non-technical teammates modify queries without touching code. Change the date range, filter by region, adjust thresholds, all through a friendly interface while MotherDuck and DuckDB handle the heavy computation.
The real benefit? Your analysis isn’t trapped in a notebook on your laptop. It’s in a shared workspace where others can see your work, ask questions by running additional queries, and build on your analysis, all powered by MotherDuck’s cloud infrastructure.
Advanced Features: Reading Multiple Files at Once
DuckDB has some tricks that’ll make you wonder how you lived without them. One of my favorites is glob patterns for reading multiple files:
# Read all CSV files matching a pattern
duckdb.query("""
    SELECT * FROM 'sales_2024_*.csv'
""").df()

# Read all files in a directory
duckdb.query("""
    SELECT * FROM 'data/*.parquet'
""").df()
his is perfect when you’ve got data split across multiple files, maybe one per month or per region. DuckDB automatically combines them and treats them as a single table. No manual loop to read and concatenate each file.
You can even get fancy with it:
# Read from multiple directories, with filename metadata
duckdb.query("""
    SELECT
        filename,
        *
    FROM read_csv_auto('2024/*/sales.csv', filename=true)
""").df()
That filename=true parameter adds a column showing which file each row came from. Super handy when you need to track data lineage or debug issues.
Window Functions and Advanced SQL
DuckDB supports all the advanced SQL features you’d expect from a modern database. Window functions, CTEs, recursive queries, it’s all there.
Here’s a practical example calculating running totals:
query = """
    SELECT
        order_date,
        order_value,
        SUM(order_value) OVER (
            ORDER BY order_date
            ROWS BETWEEN UNBOUNDED PRECEDING AND CURRENT ROW
        ) as running_total
    FROM orders
    ORDER BY order_date
"""

duckdb.sql(query).show()
Or maybe you want to rank products within each category:
query = """
    SELECT
        category,
        product_name,
        sales,
        RANK() OVER (
            PARTITION BY category
            ORDER BY sales DESC
        ) as rank_in_category
    FROM product_sales
    QUALIFY rank_in_category <= 5
"""

duckdb.sql(query).df()
That QUALIFY clause is a DuckDB extension that lets you filter on window function results directly. It’s cleaner than wrapping everything in a subquery.
Dealing with Complex Data Types
One thing that trips people up is DuckDB’s support for complex types like arrays, structs, and maps. This isn’t just theoretical, real-world data often has nested structures, especially JSON and Parquet files.
# Working with array columns
duckdb.query("""
    SELECT
        customer_id,
        product_tags,
        UNNEST(product_tags) as individual_tag
    FROM customer_purchases
""").df()

# Working with JSON
duckdb.query("""
    SELECT
        id,
        metadata->>'$.user.name' as user_name,
        metadata->>'$.user.email' as user_email
    FROM events
""").df()
The UNNEST function explodes arrays into individual rows, perfect for analyzing tag-based data. And that JSON extraction syntax? It’s based on PostgreSQL’s operators, so if you know Postgres, you’re already ahead.
Performance Tips That Actually Matter
DuckDB is fast out of the box, but you can make it even faster with a few tricks. And if you’re using MotherDuck, you get additional performance benefits from cloud-based query execution.
Use Parquet instead of CSV. Seriously, the performance difference is dramatic. Parquet is compressed and columnar, which means DuckDB can skip reading entire columns it doesn’t need. CSV requires reading everything.
Leverage MotherDuck for large datasets. If you’re working with data that’s too big for your laptop, MotherDuck’s cloud execution will dramatically outperform local processing. The dual execution model automatically routes compute to where it makes sense.
Create indexes for repeated queries. If you’re filtering or joining on the same columns repeatedly:
con.execute("CREATE INDEX idx_customer_id ON orders(customer_id)")
Use COPY for bulk inserts. If you’re loading data into a table:
# Slow way
con.execute("INSERT INTO sales SELECT * FROM 'data.csv'")

# Fast way
con.execute("COPY sales FROM 'data.csv'")
Adjust memory limits if needed. DuckDB automatically manages memory, but you can tune it:
con.execute("SET memory_limit='8GB'")
con.execute("SET threads=8")
With MotherDuck, let the optimizer decide. You can specify whether operations should run locally or remotely, but usually the automatic optimization is smarter than manual control:
# Let MotherDuck decide (recommended)
result = con.execute("SELECT * FROM md:my_database.large_table").df()

# Or force remote execution if needed
con.execute("SET md_run=REMOTE")
Common Patterns and Real-World Examples
Let me show you some patterns I use constantly.
Pattern 1: Exploratory Analysis
import duckdb

# Quick profiling of a dataset
duckdb.query("""
    SELECT
        COUNT(*) as row_count,
        COUNT(DISTINCT customer_id) as unique_customers,
        MIN(order_date) as earliest_order,
        MAX(order_date) as latest_order,
        AVG(order_value) as avg_order_value,
        MEDIAN(order_value) as median_order_value
    FROM 'orders.parquet'
""").show()
Pattern 2: Data Quality Checks
# Find duplicates
duckdb.query("""
    SELECT
        customer_id,
        COUNT(*) as duplicate_count
    FROM customers
    GROUP BY customer_id
    HAVING COUNT(*) > 1
""").df()

# Check for nulls
duckdb.query("""
    SELECT
        SUM(CASE WHEN email IS NULL THEN 1 ELSE 0 END) as missing_emails,
        SUM(CASE WHEN phone IS NULL THEN 1 ELSE 0 END) as missing_phones,
        COUNT(*) as total_records
    FROM customers
""").show()
Pattern 3: Time Series Aggregation
# Daily active users with 7-day moving average
duckdb.query("""
    SELECT
        event_date,
        COUNT(DISTINCT user_id) as daily_active_users,
        AVG(COUNT(DISTINCT user_id)) OVER (
            ORDER BY event_date
            ROWS BETWEEN 6 PRECEDING AND CURRENT ROW
        ) as rolling_7day_avg
    FROM user_events
    GROUP BY event_date
    ORDER BY event_date
""").df()
In Livedocs, these patterns become reusable templates that your whole team can use. Someone asks “how many active users do we have?”, you already have the query, and they can run it themselves with updated parameters.
Exporting and Sharing Results
Once you’ve done your analysis in DuckDB, you’ll want to share results. Here are some common patterns:
# Export to CSV
duckdb.query("""
    COPY (
        SELECT * FROM analysis_results
    ) TO 'output.csv' (HEADER, DELIMITER ',')
""")

# Export to Parquet (recommended for large datasets)
duckdb.query("""
    COPY analysis_results TO 'output.parquet' (FORMAT PARQUET)
""")

# Export to multiple files if result is large
duckdb.query("""
    COPY analysis_results TO 'output' (FORMAT PARQUET, PARTITION_BY (region))
""")
That last one is slick, it automatically partitions your output by region, creating separate files for each. Great for distributing data to different teams.
In Livedocs, you can skip explicit exports and just share the live document. People can see your queries, results, and visualizations without you having to generate static reports.
When DuckDB Isn’t the Right Choice
Let’s be real about limitations. DuckDB is amazing, but it’s not for everything.
Don’t use DuckDB for:
- High-concurrency transaction processing (use PostgreSQL or MySQL)
- Multi-terabyte datasets that exceed a single machine’s capacity (use Snowflake or BigQuery)
- Real-time streaming data (use ClickHouse or Druid)
- Applications requiring strong multi-user write concurrency
Do use DuckDB for:
- Local data analysis and exploration
- ETL pipelines that don’t need distributed computing
- Prototyping before scaling to production systems
- Analysis on edge devices or embedded systems
- Anything pandas does, but bigger and faster
The sweet spot is roughly 1MB to 500GB of data. Below that, pandas is fine. Above that, you probably need distributed computing.
Putting It All Together
Let’s walk through a realistic scenario. You’ve got three data sources: sales data in S3, customer data in a local CSV, and product categories in a pandas DataFrame. You want to analyze which product categories are driving growth.
import duckdb
import pandas as pd

# Initialize connection
con = duckdb.connect()

# Load the httpfs extension for S3 access
con.execute("INSTALL httpfs")
con.execute("LOAD httpfs")

# Load product categories from pandas
categories_df = pd.DataFrame({
    'product_id': [1, 2, 3, 4, 5],
    'category': ['Electronics', 'Clothing', 'Electronics', 'Home', 'Clothing']
})

# Create a comprehensive analysis
analysis = con.execute("""
    WITH sales_with_categories AS (
        SELECT
            s.*,
            c.category
        FROM 's3://company-bucket/sales/*.parquet' s
        LEFT JOIN categories_df c ON s.product_id = c.product_id
    ),
    monthly_metrics AS (
        SELECT
            category,
            DATE_TRUNC('month', sale_date) as month,
            SUM(sale_amount) as revenue,
            COUNT(DISTINCT customer_id) as unique_customers
        FROM sales_with_categories
        WHERE sale_date >= '2024-01-01'
        GROUP BY category, month
    )
    SELECT
        category,
        month,
        revenue,
        unique_customers,
        revenue - LAG(revenue) OVER (
            PARTITION BY category
            ORDER BY month
        ) as revenue_growth,
        ROUND(
            100.0 * (revenue - LAG(revenue) OVER (
                PARTITION BY category
                ORDER BY month
            )) / LAG(revenue) OVER (
                PARTITION BY category
                ORDER BY month
            ),
            2
        ) as growth_rate_pct
    FROM monthly_metrics
    ORDER BY category, month
""").df()

print(analysis)
This query combines data from S3, a pandas DataFrame, and performs complex window functions to calculate month-over-month growth. In pandas, this would be 50+ lines of code and probably require multiple merge operations. In DuckDB? One query.
In Livedocs, you’d add markdown explanations around this query, create interactive visualizations of the growth trends, and let stakeholders explore different time periods or categories themselves.
Final Thoughts
You know what’s cool about DuckDB’s trajectory? It’s appearing in unexpected places. People are embedding it in web applications, mobile apps, and edge devices. There’s even DuckDB-Wasm that runs entirely in your browser.
The fundamental insight is that you don’t always need a massive cloud data warehouse. Sometimes you just need to analyze data where it lives, quickly and efficiently, without the overhead of distributed systems.
That’s the promise of tools like DuckDB combined with platforms like Livedocs. Fast, local analysis with the collaboration and sharing features of cloud platforms. You get the best of both worlds.
The best, fastest agentic notebook 2026? Livedocs.
- 8x speed response
- Ask agent to find datasets for you
- Set system rules for agent
- Collaborate
- And more
Get started with Livedocs and build your first live notebook in minutes.
- 💬 If you have questions or feedback, please email directly at a[at]livedocs[dot]com
- 📣 Take Livedocs for a spin over at livedocs.com/start. Livedocs has a great free plan, with $10 per month of LLM usage on every plan
- 🤝 Say hello to the team on X and LinkedIn
Stay tuned for the next article!
Ready to analyze your data?
Upload your CSV, spreadsheet, or connect to a database. Get charts, metrics, and clear explanations in minutes.
No signup required — start analyzing instantly

