How To Conduct Market Research With AI
Remember when market research meant drowning in Excel spreadsheets, wrestling with Python libraries you barely understood, and spending half your morning just trying to remember which pip command installs pandas?
Yeah, those days might be behind us.
Livedocs AI just rolled out something pretty interesting, an agent mode that lets you ask questions and get actual, useful answers without touching a single line of code.
No installations. No debugging. Just questions and insights. Honestly? It feels a bit like cheating, but in the best possible way. Users love the new feature so far.
The Old Way
Let me paint you a picture. You’re tasked with analyzing market trends for your quarterly report. Here’s what that looked like until, now:
First, you’d open laptop and start the day. Install Python (or remember where you installed it last time). Create a virtual environment because you learned that lesson the hard way. Then comes the fun part, installing packages. Pandas, NumPy, Matplotlib, Seaborn. Maybe Plotly if you’re feeling fancy.
pip install pandas numpy matplotlib seaborn
Once you’ve got your environment sorted, we’re 45 minutes in, you’d need to write code. Import your data, clean it (because it’s always messy), handle missing values, format dates that somehow imported as strings, and then finally start analyzing.
You know what the worst part was? Every single question meant more code. Want to see a different time range? Rewrite your filtering logic. Need a different chart type? Back to the Matplotlib documentation. Trying to explain your findings to your boss who doesn’t read Python? Good luck translating code into business speak.
The traditional approach wasn’t just time-consuming, it created this weird barrier between asking questions and getting answers. You’d often forget what you were originally trying to find out because you got so tangled up in the technical stuff.
You know what the worst part was? Every single question meant more code. And Livedocs makes it no-code needed.
Enter Livedocs AI Agent Mode
Here’s where things get interesting. Livedocs AI’s agent mode flips the entire script.
- Instead of writing code, you’re having a conversation.
- Instead of installing libraries, you’re uploading data.
- Instead of debugging, you’re refining questions.
Getting Started: Literally Just Ask
The interface is refreshingly simple. You’ve got your data sources on the left, connect to Google Drive, upload CSV files, link databases, even pull from S3 buckets. On the right, there’s a chat interface that actually works like chat should work.
Let’s say you’re analyzing e-commerce sales data. Traditional approach? You’d start writing pandas queries. With agent mode? You just ask:
“Show me monthly revenue trends for the past year”
That’s it. No df.groupby(), no datetime parsing, no matplotlib.pyplot.figure() nonsense. The agent understands what you mean, processes your data, and generates a clean visualization. And here’s the kicker, it saves the chart automatically.
Real Market Analysis: A Walkthrough
Alright, let’s get practical. Say you’re conducting competitive market analysis for a SaaS product. You’ve got data on pricing, features, customer reviews, and market share from various sources. Here’s how this actually works with agent mode.
Step 1: Upload Your Context
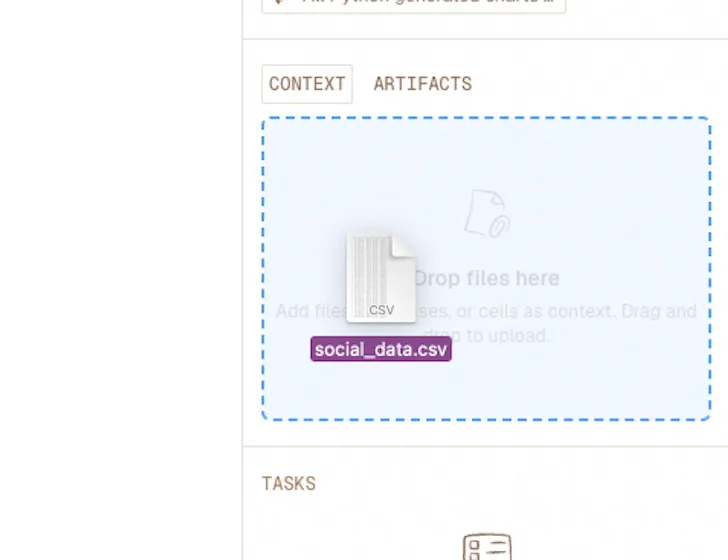
This part’s straightforward. You can drag and drop CSV files, connect your Google Sheets, or link directly to your company’s database. The agent mode supports multiple data sources simultaneously, which is huge.
In traditional analysis, you’d be writing merge operations and worrying about key columns. Here? Just upload everything and let the agent figure out the relationships.
Step 2: Start With Broad Questions
Don’t overthink it. Start conversational:
“What’s the average pricing across our competitor set?”
The agent processes this, understands you want summary statistics, and delivers. But here’s where it gets clever, it also shows you the methodology. You can see exactly what it calculated, which builds trust. No black box weirdness.
You might follow up with:
“How does pricing correlate with market share?”
Traditional approach would require joining datasets, calculating correlations, maybe running a regression analysis. Agent mode just does it. Generates a scatter plot, calculates the Pearson coefficient, and explains the relationship in plain English.
You can see exactly what it calculated, which builds trust. No black box weirdness.
Step 3: Dig Deeper
This is where agent mode really shines. Because you’re not context-switching between coding and thinking, you can actually follow your curiosity. Questions lead to more questions naturally:
“Show me the feature comparison for the top 5 competitors”
“Which features appear most frequently in positive reviews?”
“Are there seasonal patterns in market share changes?”
Each question builds on the last. The agent maintains context, so you’re genuinely exploring your data rather than executing predetermined queries. It feels less like programming and more like investigating, which is what analysis should feel like.
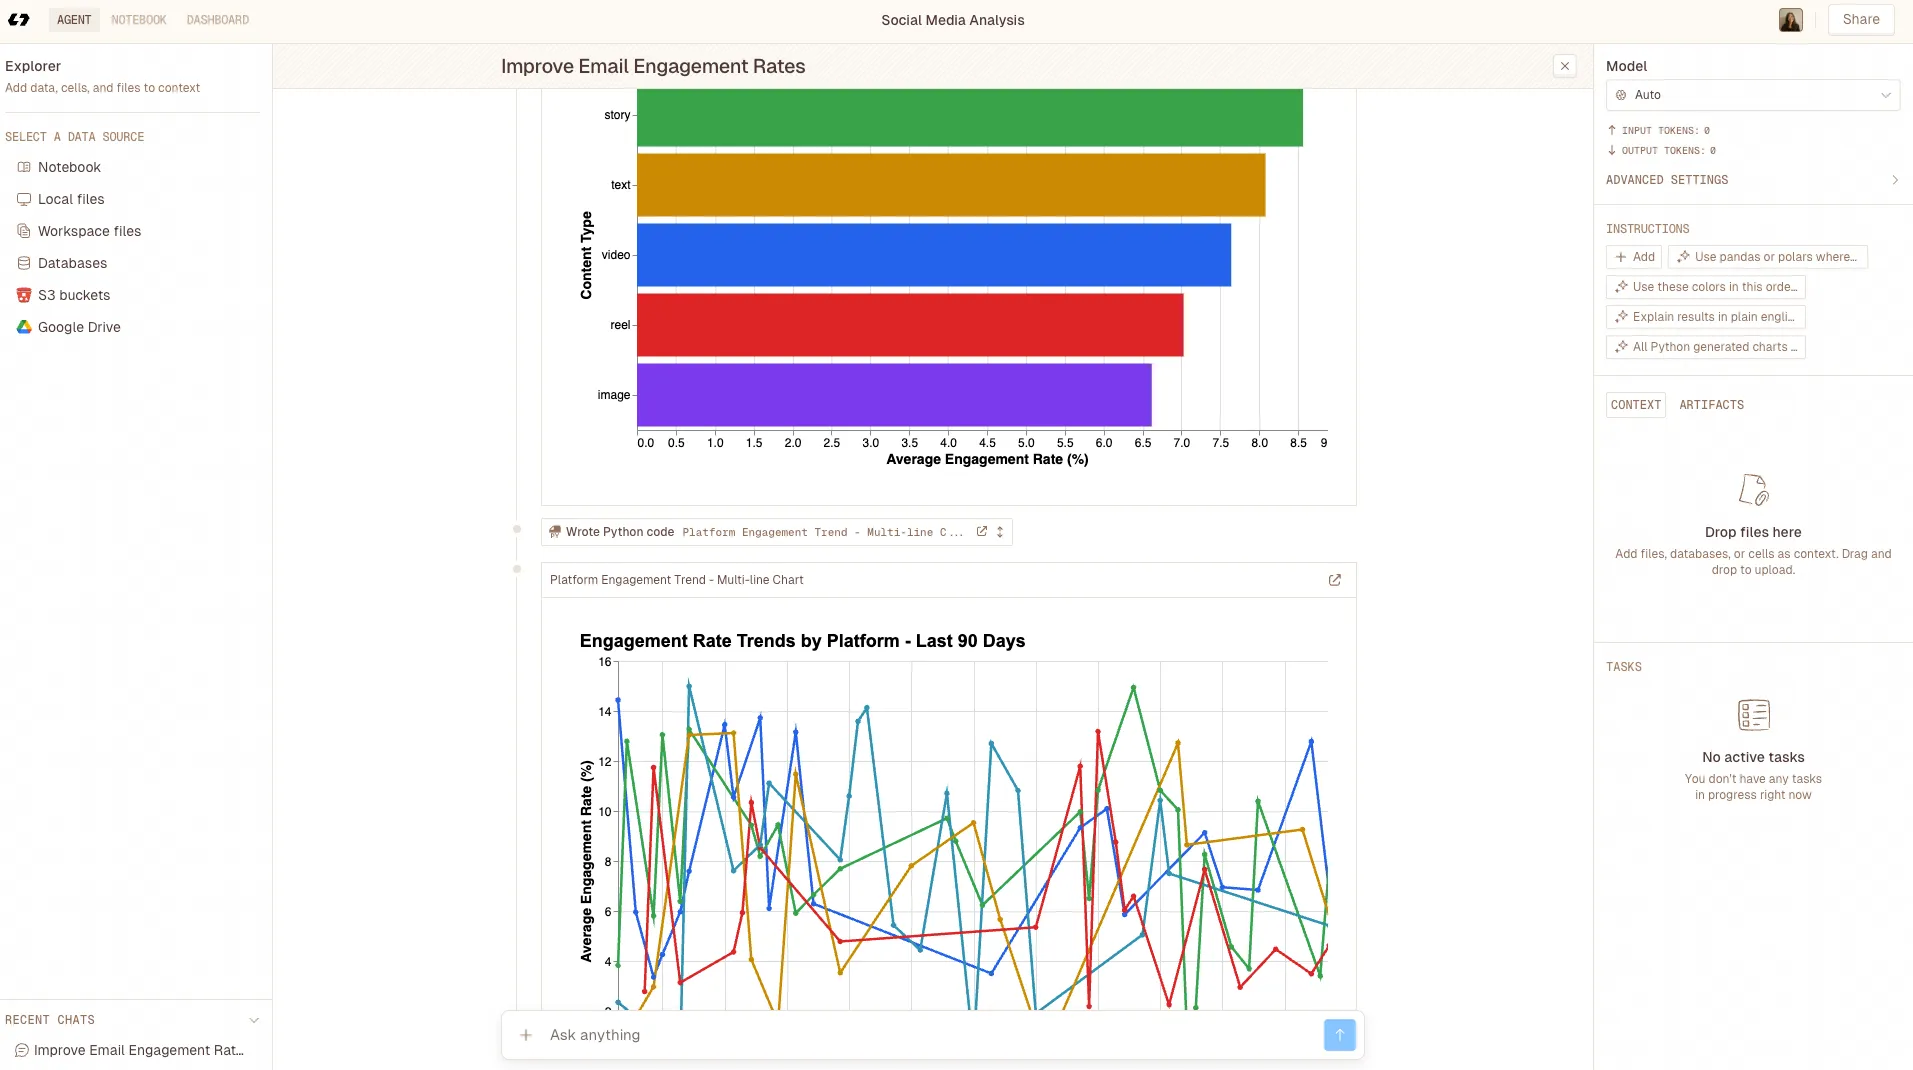
The Charts Actually Look Good
Can we talk about this for a second? How much time have we collectively wasted trying to make matplotlib charts not look terrible? Adjusting figure sizes, tweaking colors, fixing legends that overlap with data points, rotating x-axis labels so they’re actually readable…
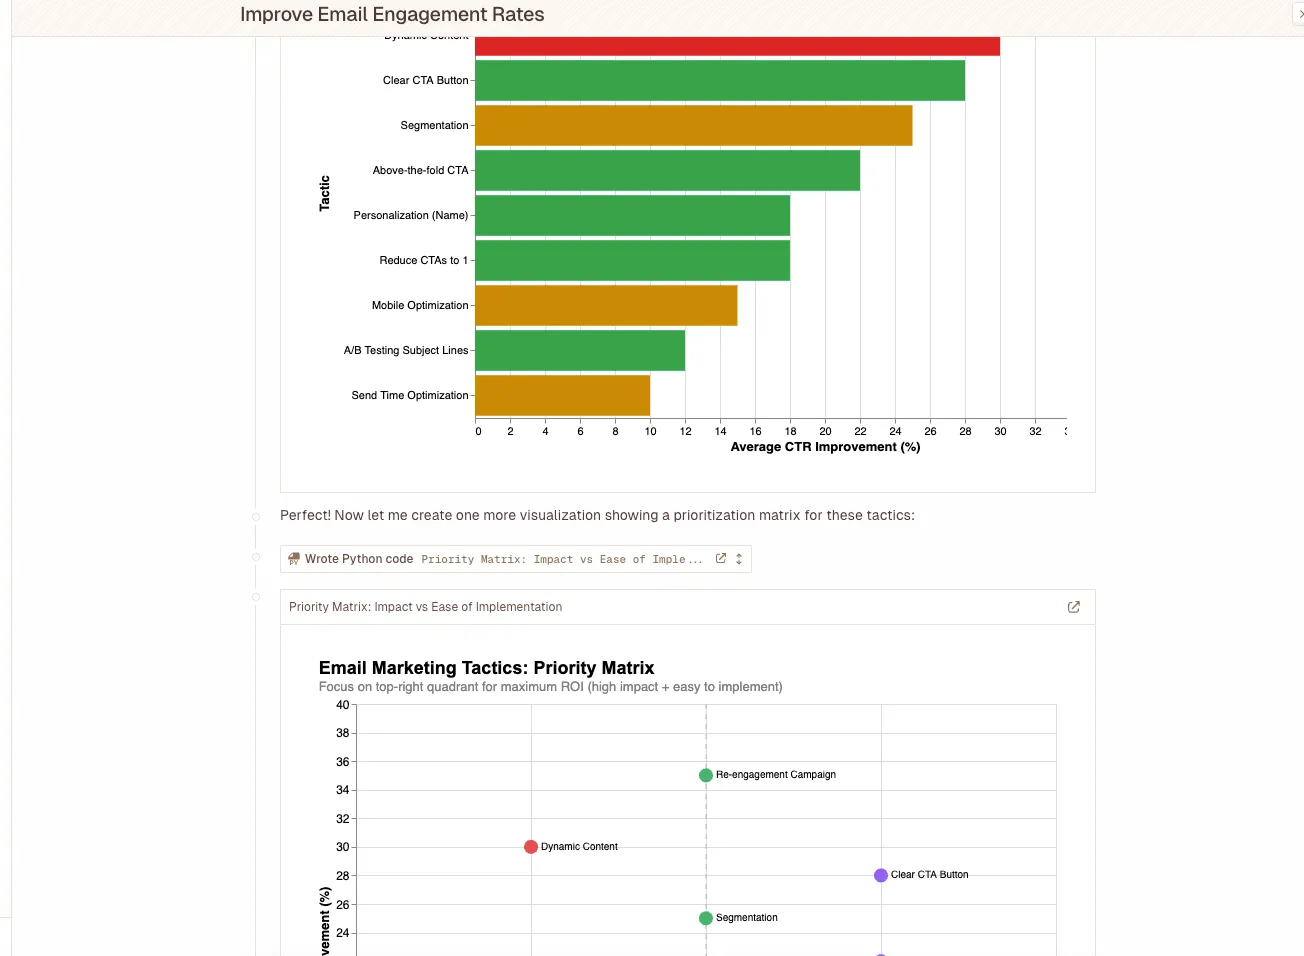
Agent mode generates publication-ready visualizations. Clean color schemes, proper labeling, appropriate chart types for your data. If you don’t like something, you just ask for changes:
“Can you make that bar chart horizontal instead?”
“Add a trend line to the scatter plot”
“Use our brand colors, blue and orange”
It’s responsive. It understands context. And critically, it saves everything automatically, so you’re building a library of analysis artifacts without thinking about it.
Where This Really Shines:
Here’s something that doesn’t get talked about enough, analysis isn’t linear. You don’t ask one question, get one answer, and call it done. Real research involves iteration, backtracking, impromptu ideas, and lots of thinking.
Traditional coding workflows punish iteration. Every pivot means rewriting code, re-running notebooks, fixing broken dependencies. Agent mode makes pivoting trivial. Changed your mind about the date range? Just ask. Want to segment differently? Tell it. Realized you need to exclude outliers? Say so.
This speed changes how you think. You’re more willing to explore tangents, test hypotheses, challenge assumptions, because the cost of asking “what if?” dropped to basically zero.
Collaboration Gets Easier Too
Try explaining your Python analysis to the marketing team.
With agent mode, your entire analytical conversation is right there in plain English. Anyone can follow your reasoning, see what questions you asked, understand your methodology. No translation layer needed.
Better yet, teammates can jump in and continue the analysis. They don’t need to understand your code or recreate your environment. They just pick up the conversation where you left off. For distributed teams or cross-functional projects, this is kind of revolutionary.
The Limitations
Let’s be real for a minute. Agent mode isn’t magic, and it’s not replacing data scientists tomorrow. There are limitations worth acknowledging.
For extremely complex statistical modeling, think advanced machine learning, custom algorithms, or highly specialized analyses, you’ll still want direct code access. Agent mode is incredibly capable for the 80% of market analysis that’s exploratory, descriptive, and visual. But that last 20% of super technical work? Code still wins.
Also, you’re working within the agent’s interpretation of your questions. Most of the time it nails it. Sometimes you need to rephrase or clarify. That’s fine, it’s still faster than debugging, but it means you can’t achieve the same pixel-perfect precision you get with manual coding.
And if you’re the type who loves coding, who finds joy in crafting elegant data transformations, you might miss it. That’s valid. Though honestly, you can still export everything and code against it if you want. The agent doesn’t lock you out.
Who Should Use This?
Product managers doing competitive research. Marketing teams analyzing campaign performance. Business analysts building quarterly reports. Startup founders trying to understand their market without hiring a data team.
Basically, if you need insights from data but coding isn’t your primary skill, or even if it is, but you’d rather spend time thinking than debugging, agent mode is worth exploring.
Even for experienced analysts, it’s a productivity multiplier. Use it for initial exploration, then drop into code for the complex stuff. Best of both worlds.
Getting Started Today
The barrier to entry is pleasantly low. Sign up for Livedocs AI, upload some data, and start asking questions. That’s literally it.
If you want a framework for your first session:
- Start with a simple question: Get comfortable with how the agent interprets your requests
- Build complexity gradually: Ask follow-ups, add filters, request different visualizations
- Save your insights: The agent archives everything, building your analysis library
- Share context: Bring in teammates, show them the conversation, let them explore too
You’ll figure out the nuances quickly. How specific to be with questions, when to provide more context, how to guide the agent toward exactly what you need.
Final Thoughts
This shift, from coding analysis to conversational analysis, isn’t just about convenience. It’s democratizing data. Making insights accessible to people who’ve got great questions but limited technical skills.
Sure, there’ll always be a place for deep technical analysis and custom code. But for the daily grind of market research, competitive intelligence, and business analysis? Removing the coding barrier means more people can participate in data-driven decisions.
And maybe that’s the real value here. Not just saving time (though you absolutely will), but enabling a broader conversation about what your data actually means. When anyone can ask questions of the data, you get perspectives you might’ve missed otherwise.
So yeah, if you’re still wrestling with virtual environments and import statements just to answer simple market research questions… maybe it’s time to try asking instead of coding. The insights are waiting; you just need to start the conversation.
The best, fastest agentic notebook 2026? Livedocs.
- 8x speed response
- Ask agent to find datasets for you
- Set system rules for agent
- Collaborate
- And more
Get started with Livedocs and build your first live notebook in minutes.
- 💬 If you have questions or feedback, please email directly at a[at]livedocs[dot]com
- 📣 Take Livedocs for a spin over at livedocs.com/start. Livedocs has a great free plan, with $10 per month of LLM usage on every plan
- 🤝 Say hello to the team on X and LinkedIn
Stay tuned for the next tutorial!
Ready to analyze your data?
Upload your CSV, spreadsheet, or connect to a database. Get charts, metrics, and clear explanations in minutes.
No signup required — start analyzing instantly

