Create Live Dashboards With No Code
Still presenting from static Google Sheets? It’s time to level up.
In this guide, I’ll show you the fastest and easiest way to build a live data dashboard in 2026, no code required.
Easiest Way To Build Live Data Dashboards Without Code
Data today moves at lightning speed. Whether you’re running ads, tracking sales, or monitoring user engagement, you can’t afford to wait days for reports.
The solution? Live dashboards that update in real time and sync directly with your data sources.
Better yet, thanks to modern no-code dashboard tools, you don’t need SQL, Python, or a dedicated data team. Anyone can build dashboards that connect to spreadsheets, databases, and APIs in minutes.
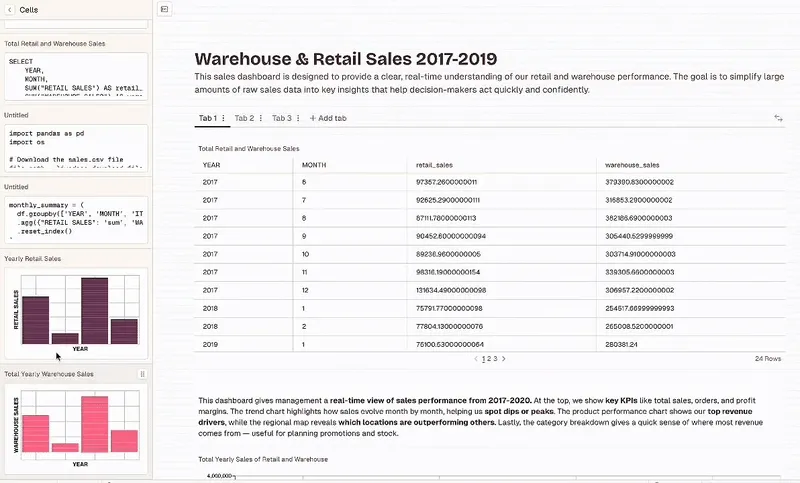
In this tutorial, we’ll walk through creating a Warehouse & Retail Sales Dashboard for a wholesale liquor supplier. By the end, you’ll have a neat, shareable, always-up-to-date dashboard ready to show your team or clients.
1. Choose your Data Source
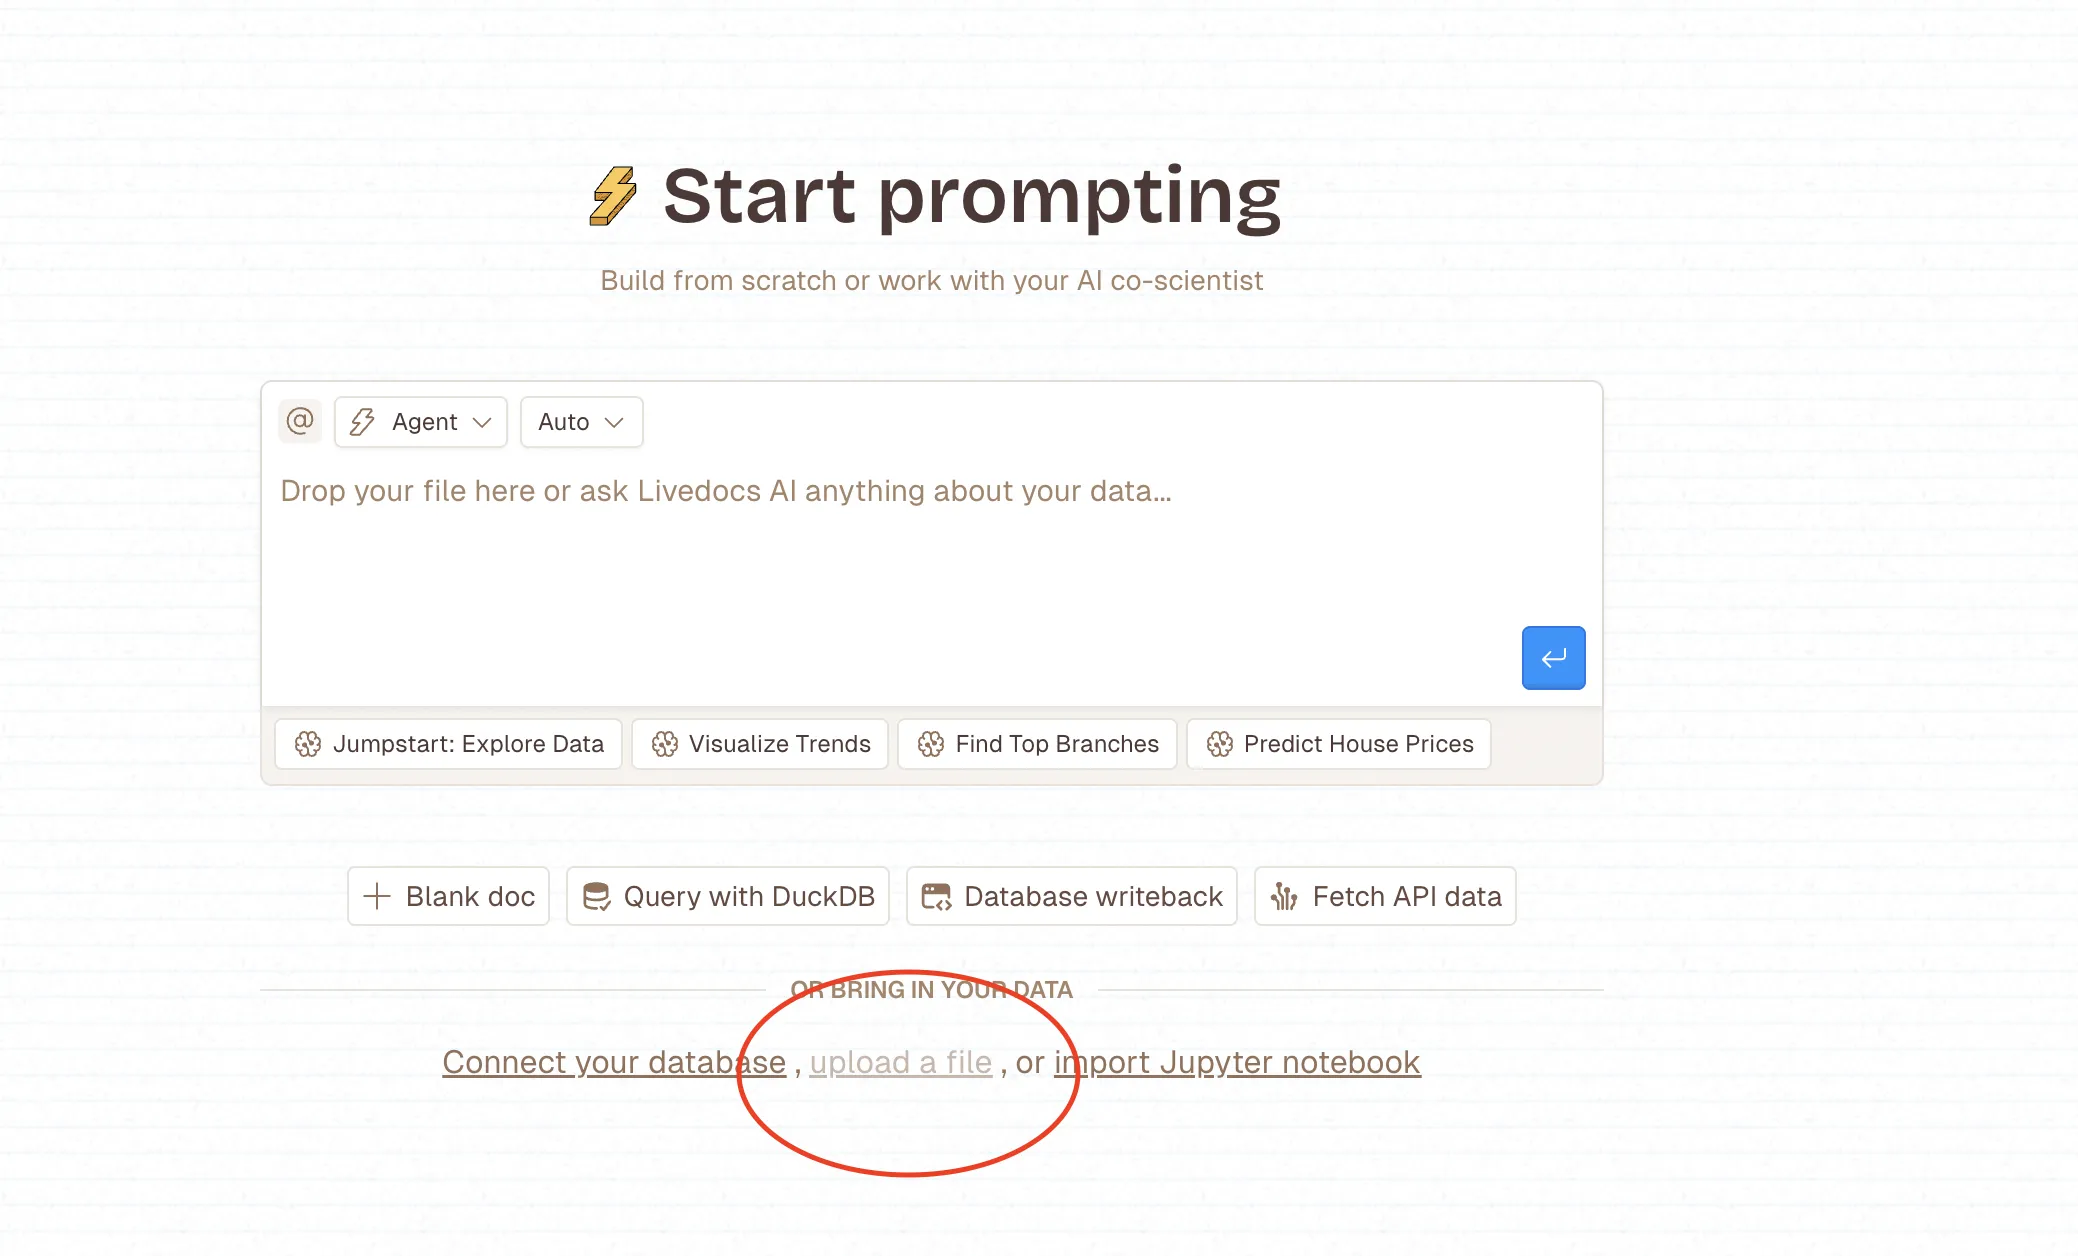
For this example, we’ll use Livedocs, a YC-backed powerful tool built for live dashboards.
- Sign up for a free account here.
- Prepare your dataset. You can connect Postgres, Snowflake, Airtable, Google Sheets, or upload an Excel/CSV file.
I’ll start with a simple Excel file containing liquor sales (wine + beer) from 2017–2020.
—
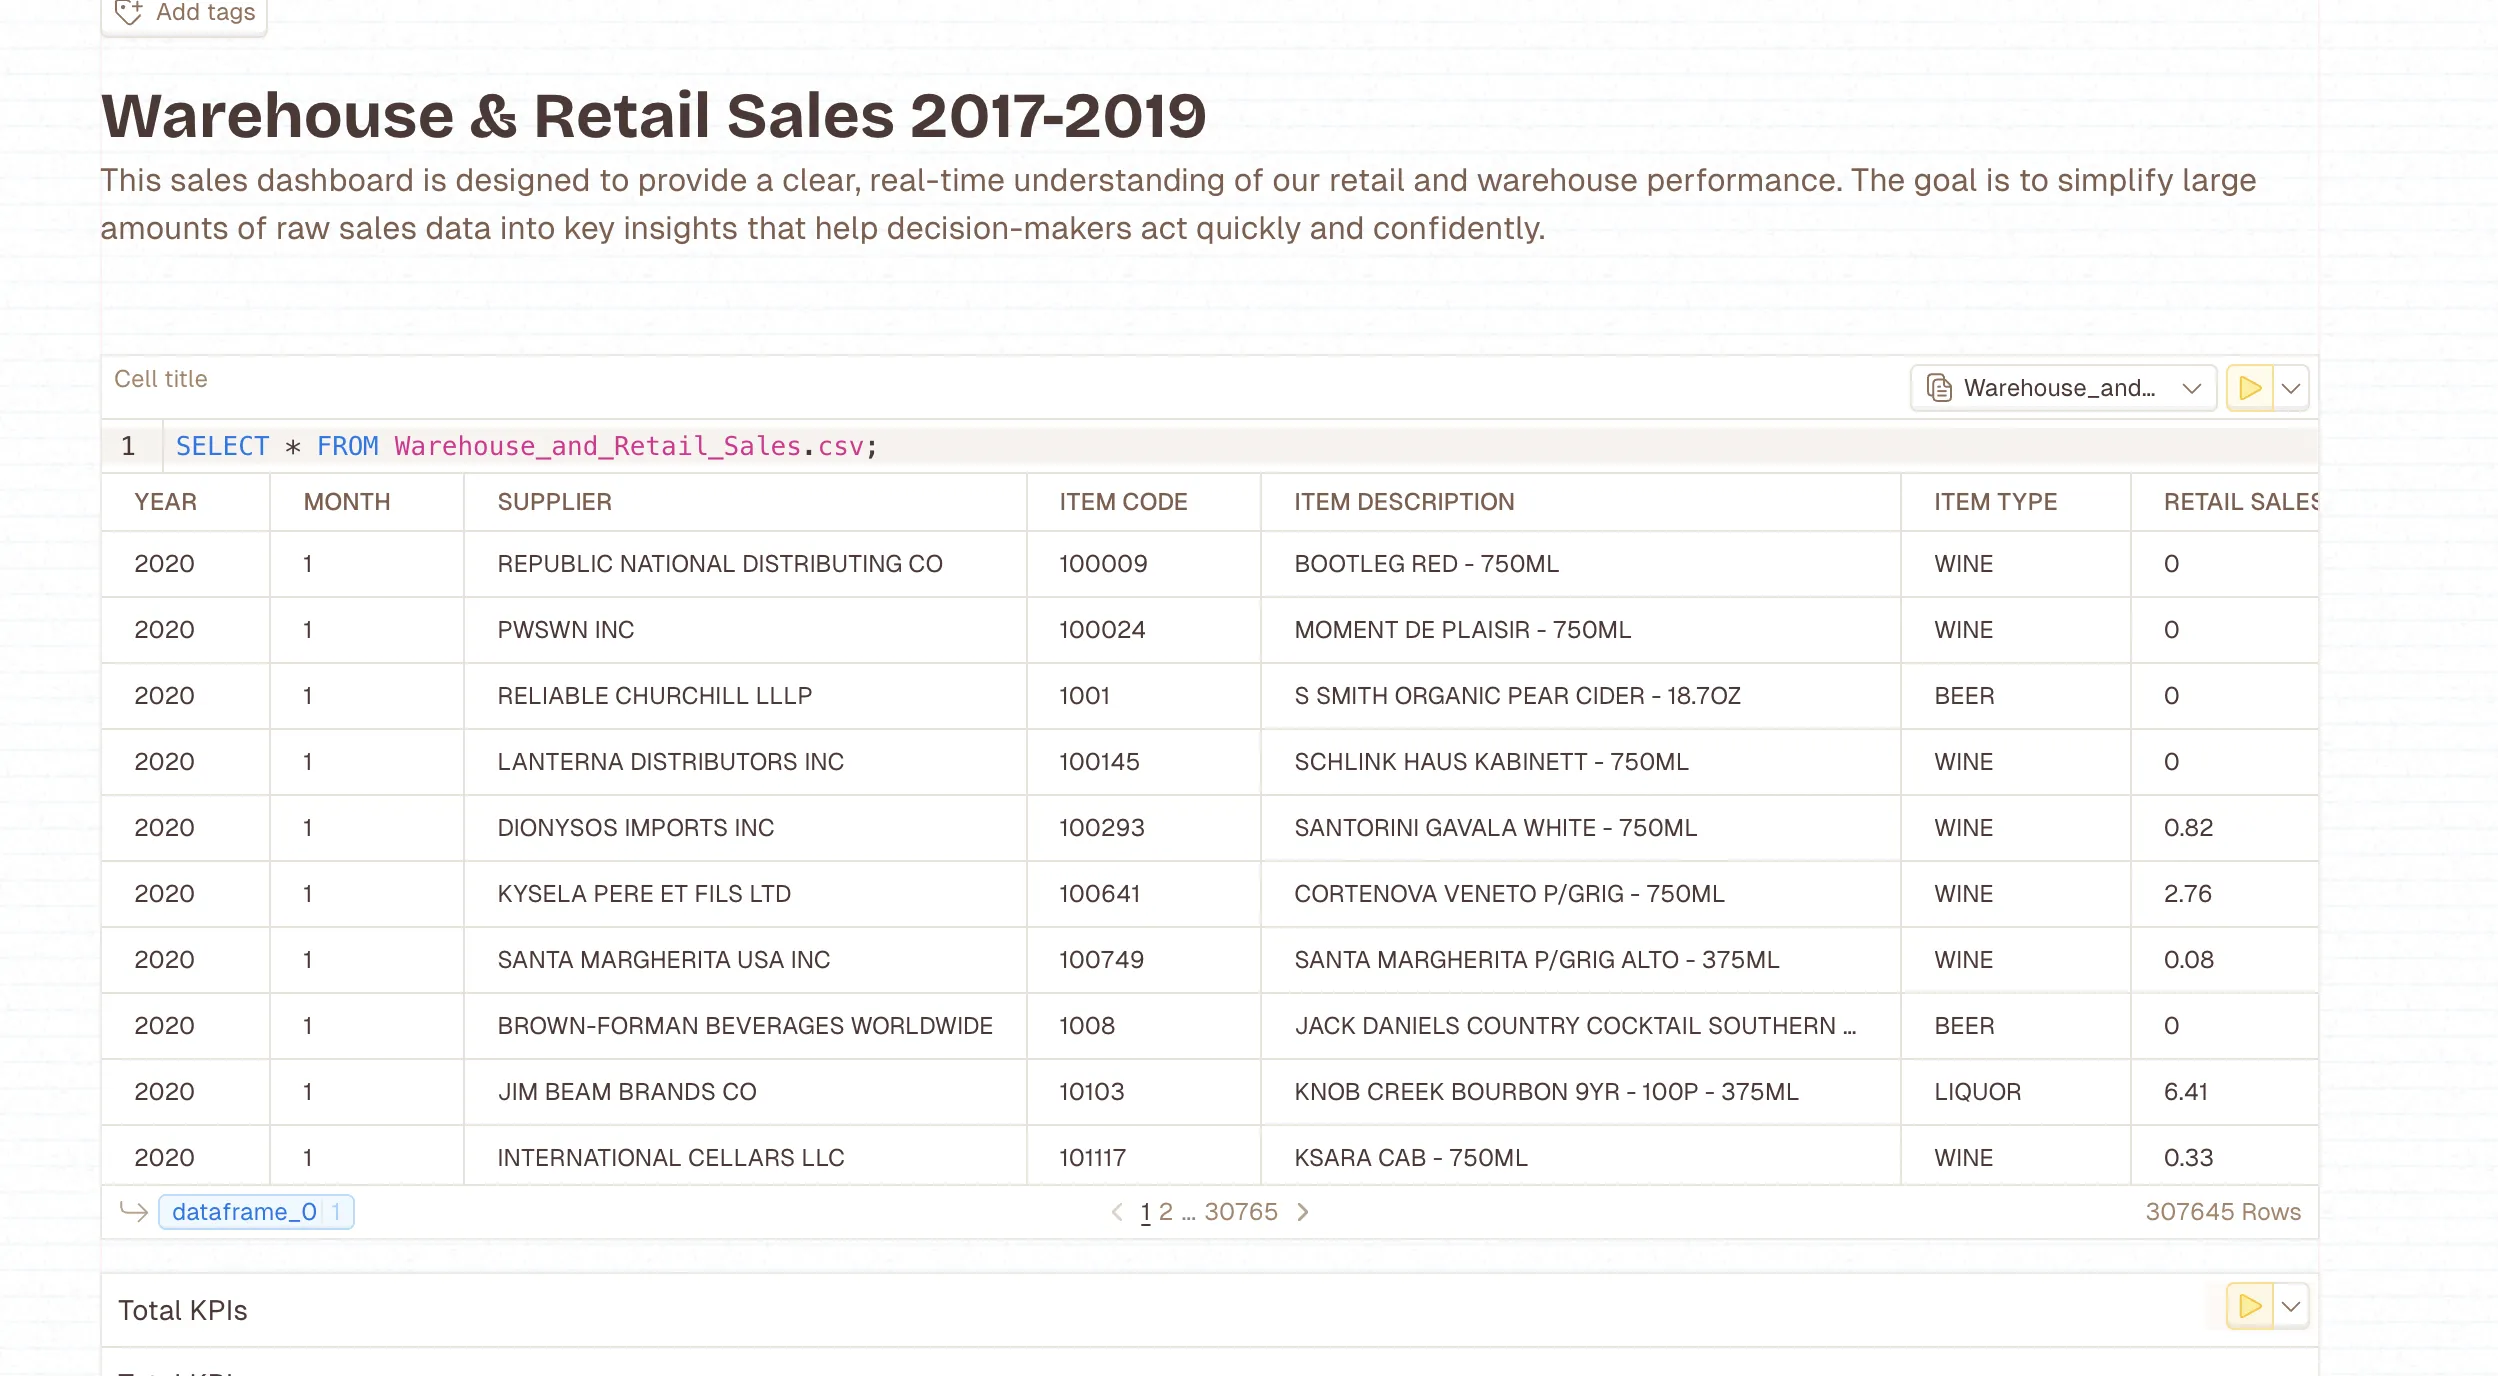
2. Observe and Update your Data
Once uploaded, you’ll see your dataset directly inside the dashboard editor.
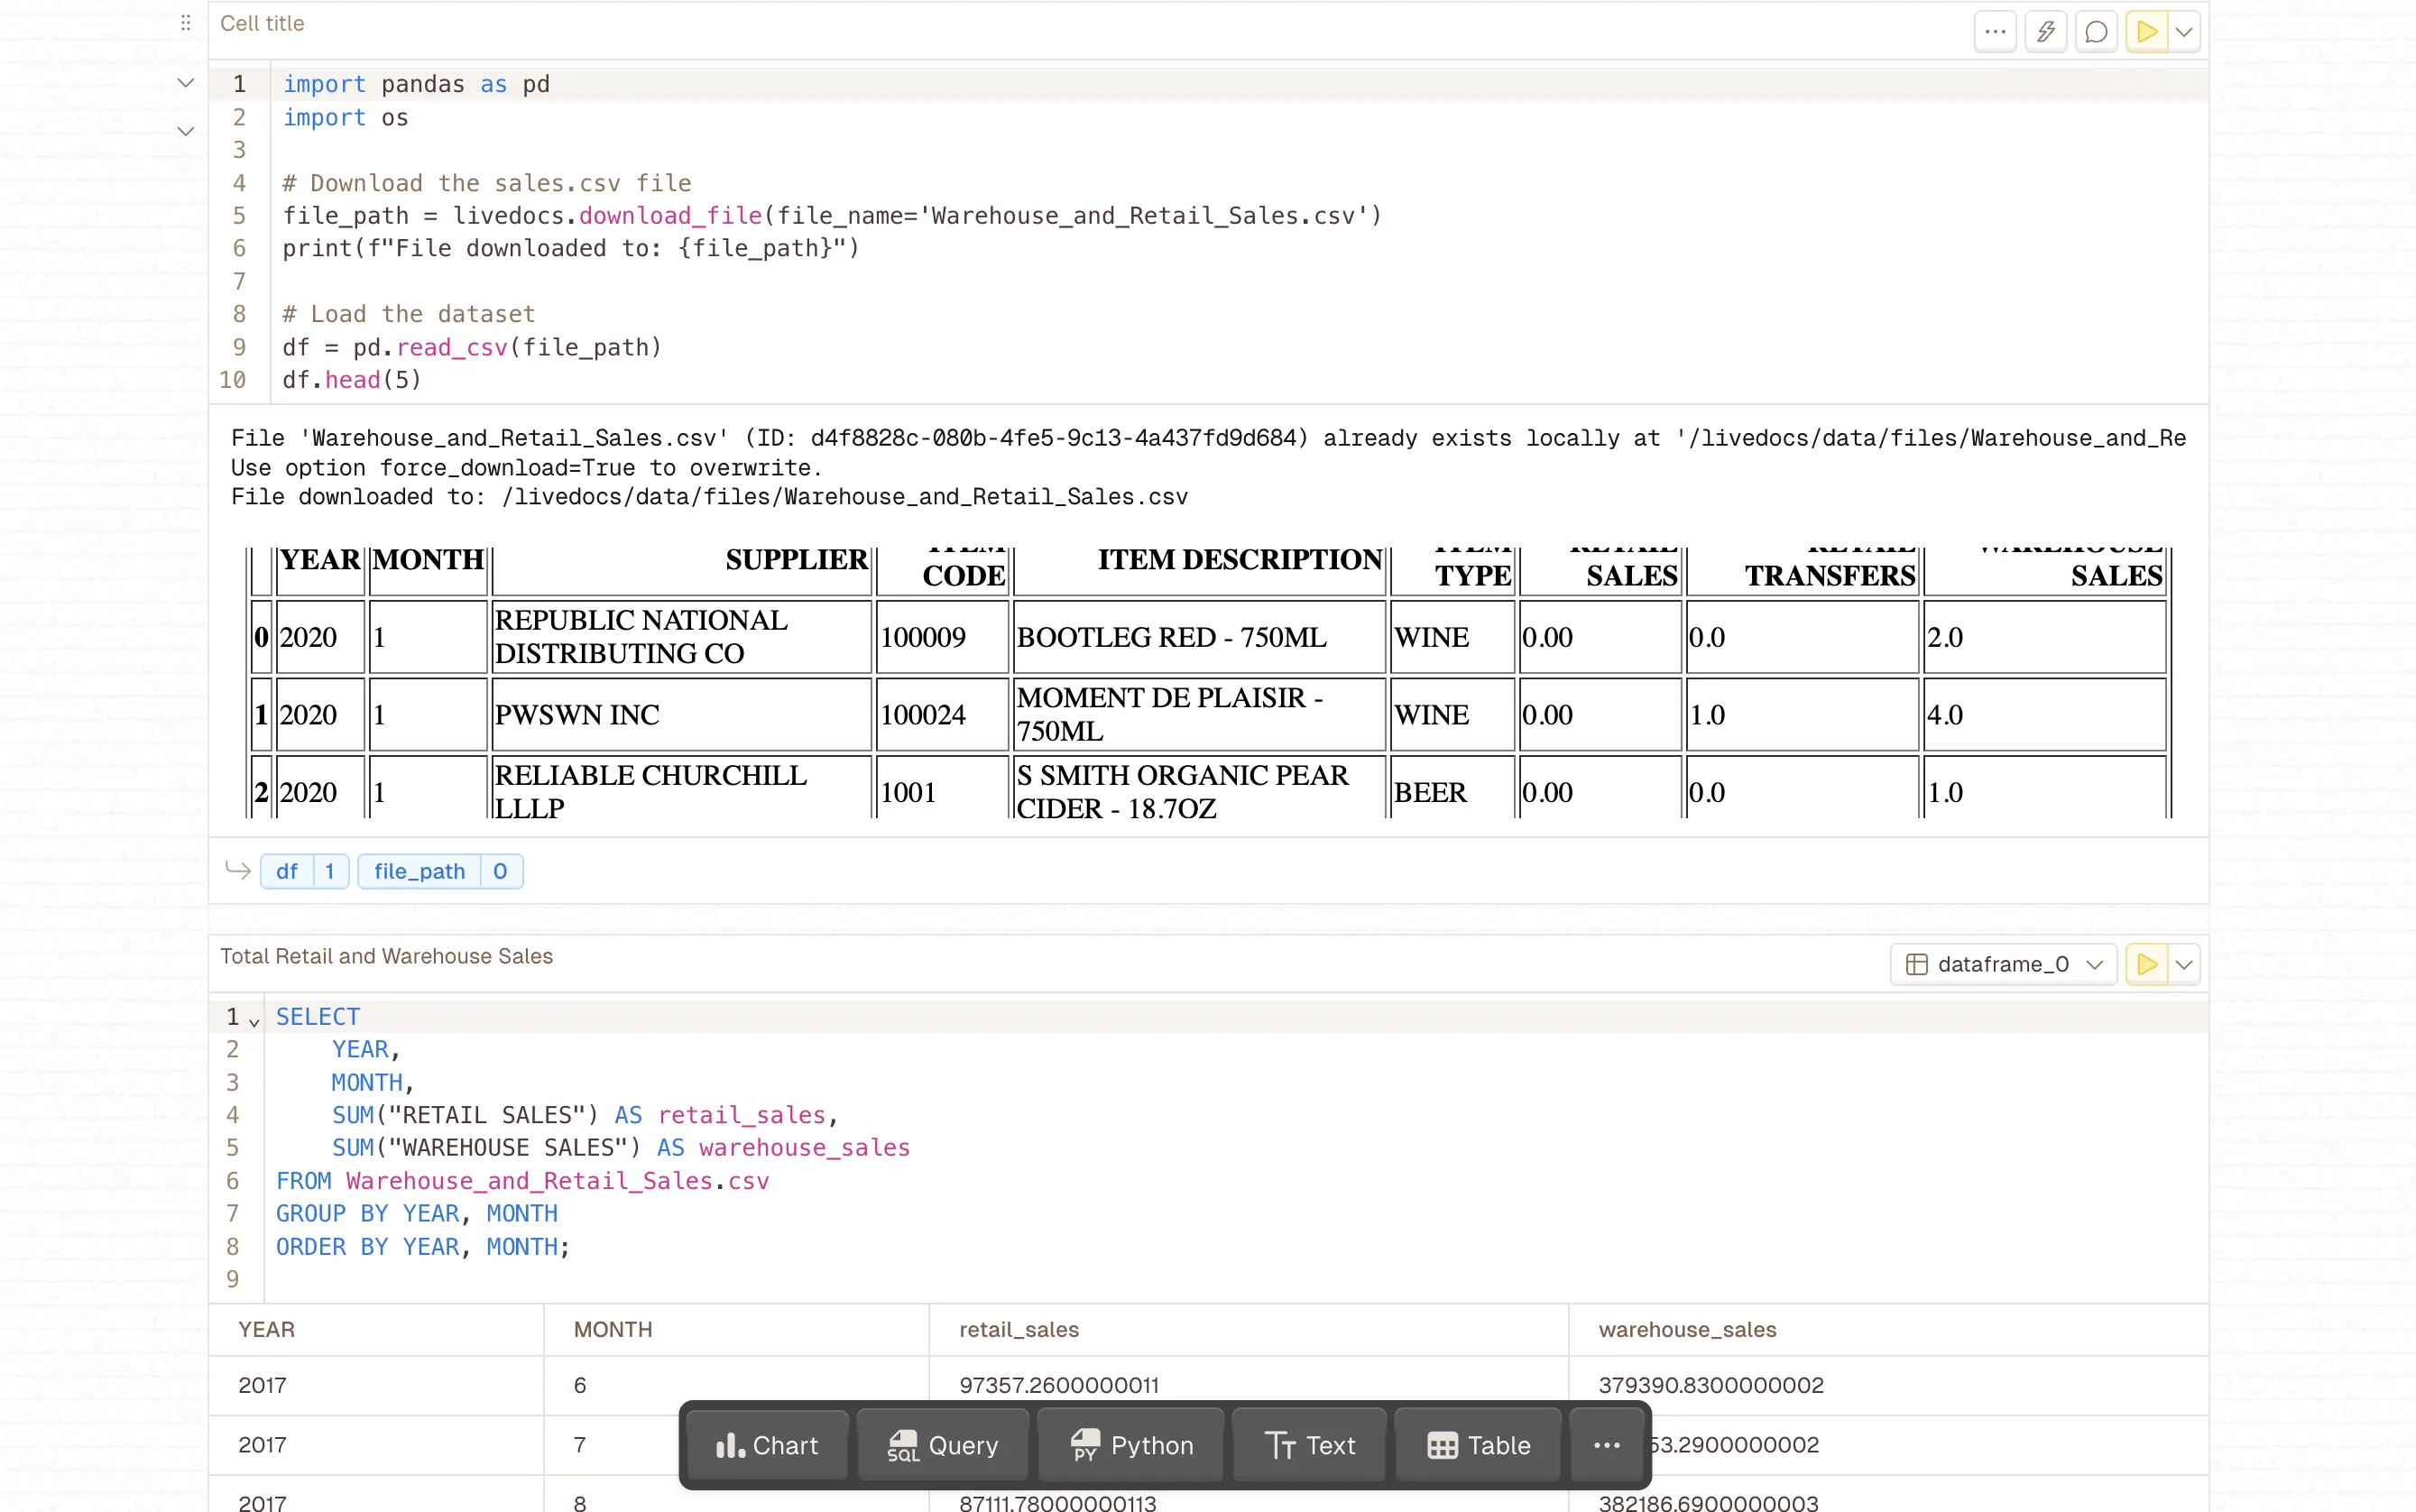
Need changes?
- Re-upload or switch to another dataset.
- Clean or transform data directly inside Livedocs.
- Use SQL or Python queries if you want advanced control.
—
3. Pick the Right Visualization for Each Metric
Dashboards aren’t about dumping numbers — they’re about telling a story with data.
Some visualization guidelines:
- Line Chart: Best for trends over time (e.g., revenue growth, user retention).
- Bar Chart: Best for comparisons (e.g., ad spend by channel, sales by region).
- Pie/Donut Chart: Good for proportions (e.g., % of revenue by product type).
- KPI Tile: Perfect for single, high-level numbers (MRR, churn %, CAC).
- Table: Useful when details matter (lists of top customers, invoices, or transactions).
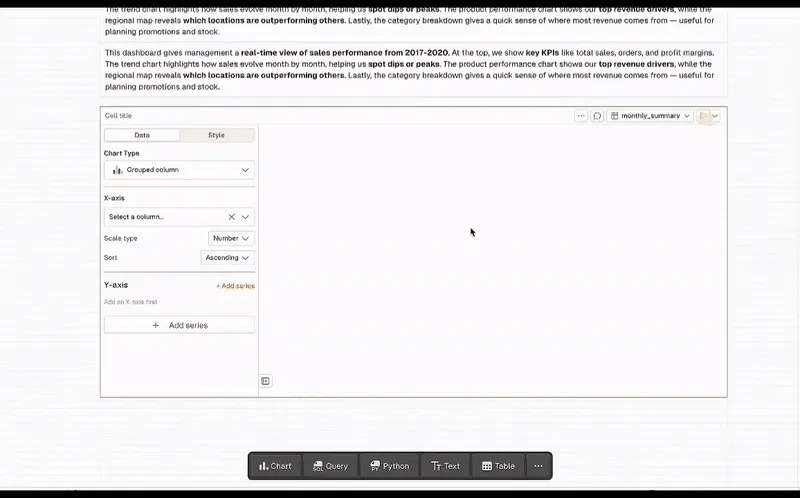
Creating a chart in Livedocs is simple:
- Click the “Chart” button.
- Select your dataset.
- Pick a visualization type.
- Assign X/Y axes, scale type, number formatting.
4. Drag-and-Drop to Build Your Dashboard Layout
Now comes the fun part — assembling your dashboard.
Livedocs provides an intuitive drag-and-drop editor:
- Add charts as widgets.
- Resize them to emphasize the most important metrics.
- Group related charts together (e.g., all marketing KPIs in one section).
- Add text labels or notes so teammates know what they’re looking at.
- Use tabs to organize flows (KPIs tab, Trends tab, Detailed Data tab)w.
Here are some example layout you can use:
- Tab 1 (Overview): KPIs — MRR, churn, CAC
- Tab 2 (Trends): Revenue growth, signups
- Tab 3 (Details): Tables with customer or campaign breakdowns
—
5. Share Your Dashboard With the Right People
A dashboard only works if your team and stakeholders can access it. With Livedocs, sharing is one click away:
- Hit Publish in the top right.
- Copy the secure link.
- Share with teammates, clients, or embed in Notion/Slack.
That’s how veryone always sees the latest, live data. Congrats for create your first live dashboard on Livedocs!
—
Final Thoughts
And that’s it — you’ve just built a live, no-code dashboard in five simple steps.
Done right, your dashboard becomes more than just charts: it’s your team’s single source of truth, always updated and always accessible.
The fastest way to get there in 2026? Livedocs.
- Instant data connections
- Drag-and-drop editor
- Real-time updates
- Easy sharing
Get started with Livedocs and build your first live dashboard in minutes.
—
- 💬 If you have questions or feedback, please email directly at a[at]livedocs[dot]com
- 📣 Take Livedocs for a spin over at livedocs.com/start. Livedocs has a great free plan, with $10 per month of LLM usage on every plan
- 🤝 Say hello to the team on X and LinkedIn
Stay tuned for the next tutorial!
Ready to analyze your data?
Upload your CSV, spreadsheet, or connect to a database. Get charts, metrics, and clear explanations in minutes.
No signup required — start analyzing instantly

