Building Low Code Finance Dashboard
Hi, I am Atharva, and I’ve been using Livedocs to generate reports and works faster without manual editing. In this article, I’m excited to share my experience on financial dashboard, and hopefully help you get more out of your workflow.
Finance Teams Need Speed, Accuracy, and Clarity
In business operations, few roles are as critical as the finance team. Their insights influence everything from pricing decisions to investment plans and operational budgets.
Yet, despite their strategic importance, much of the finance team’s time is often consumed by manual spreadsheet work, data consolidation, routine monthly reporting, and repetitive analysis.
For many organizations, generating a simple question such as:
- “Which product categories are driving the highest profit this quarter?”
- “How have discount changes impacted margins?”
- “Which region should we consider scaling next?”
requires hours of exporting CSVs, updating outdated dashboards, running pivot tables, and aligning inconsistent data formats.
This inefficiency does not come from lack of skill, it comes from lack of accessible tools.
Livedocs solves this by blending:
- AI-powered natural language analytics
- Notebook flexibility
- Visual dashboards
- Interactive variables
- Automated scheduled reporting This turns financial reporting from a manual chore into a continuous insight loop, without requiring deep analytics or engineering expertise.
The Superstore Retail Finance Scenario
To demonstrate this workflow, I am using some sample dataset like the Superstore Sales Dataset (Kaggle). It reflects real retail business transactions, making it ideal for analyzing revenue, costs, regional performance, discount behavior, and profit margins.
| Column | Description | Why It Matters |
|---|---|---|
| Order Date | When the transaction occured | Enables trend, seasonality & forecasting |
| Category / Sub-Category | Product classification | Helps identify best-performing product lines |
| Sales | Revenue generated per order | Core business growth indicator |
| Profit | Profit after costs | Determines financial sustainability |
| Discount | Percent discount applied | Used to evaluate pricing strategy effectiveness |
| Region / Segment | Geographic and customer segmentation | Supports market targeting decisions |
This dataset allows us to build realistic, insight-rich dashboards that mirror the daily work of retail and finance teams in real companies.
AI Agent Powered Analysis
Why AI-Powered Analysis Matters in Finance
In finance, every decision has a measurable impact, whether it affects budgets, pricing, profitability, or long-term strategy. Yet the biggest challenge most finance teams face is not a lack of data. The challenge is the time and effort required to turn that data into insight.
Traditional workflows look like this:
- Export raw data from ERP(Enterprise Resource Planner) or POS(Point of Sale) systems
- Clean and reformat it in spreadsheets
- Build temporary pivot tables to explore trends
- Create slides or dashboards for stakeholders
- Repeat the same steps next week, next month, next quarter
This process is slow, repetitive, and resource-heavy, and it often leads to reactive decision-making instead of strategic planning.
AI-powered analysis shifts this dynamic.
Livedocs allows finance teams to explore data by simply asking questions in plain language.
Such as:
- “What were our top profit-generating categories last quarter?”
- “How did the discount rate affect profit margins in the South region?”
- “Forecast next month’s revenue based on seasonal patterns.”
The Livedocs Agent automatically:
- Cleans and structures data
- Applies statistical and financial logic
- Generates visualizations or summaries
- Explains insights clearly
This means:
- Less manual work
- More time analyzing results
- Faster, better-informed decisions
AI doesn’t replace financial judgment, it enhances it. By automating the tedious parts of data handling and reporting, finance teams can focus on what actually matters.
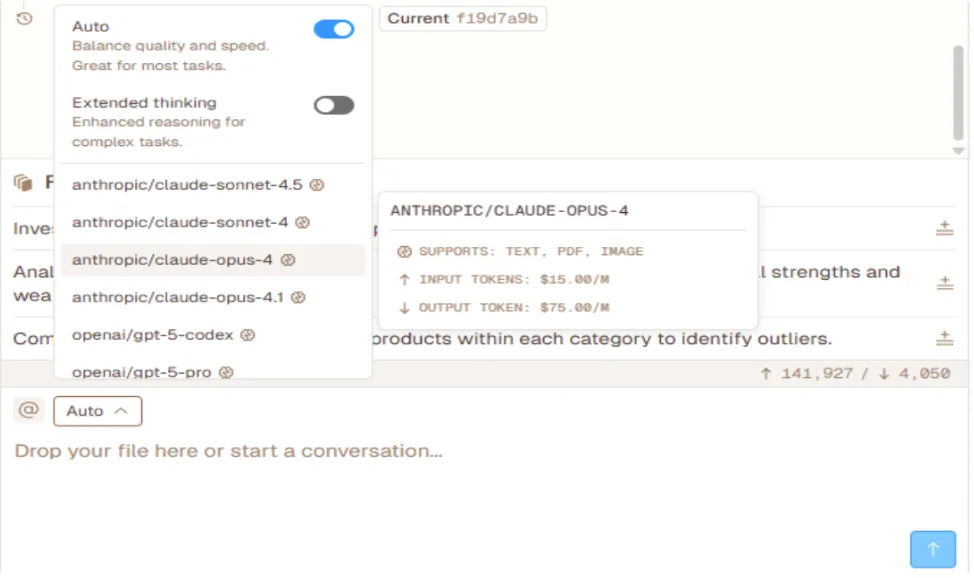
How Livedocs Chooses the Right LLM Model
Livedocs is designed to be adaptive, meaning the user does not need to manually choose which language model to run analysis with. The system intelligently selects the most suitable model based on complexity:
- For everyday tasks like summaries or basic visualizations, Livedocs may use a lightweight, fast model to keep interactions responsive.
- For more advanced reasoning such as forecasting, variance analysis, or multi-step business comparisons, Livedocs automatically switches to a larger reasoning-oriented LLM.
- If users prefer control, they can also manually select a specific model — but in most workflows, leaving it set to Auto provides the best balance between speed, accuracy, and cost-efficiency.
This Auto-Model Selection ensures:
- Optimal performance without configuration
- Faster response times for routine queries
- Higher reasoning quality when analysis is complex
With Livedocs handling both the data interpretation and the smart model selection, finance teams gain clear, accurate insights faster, without needing to manage technical settings or model parameters.
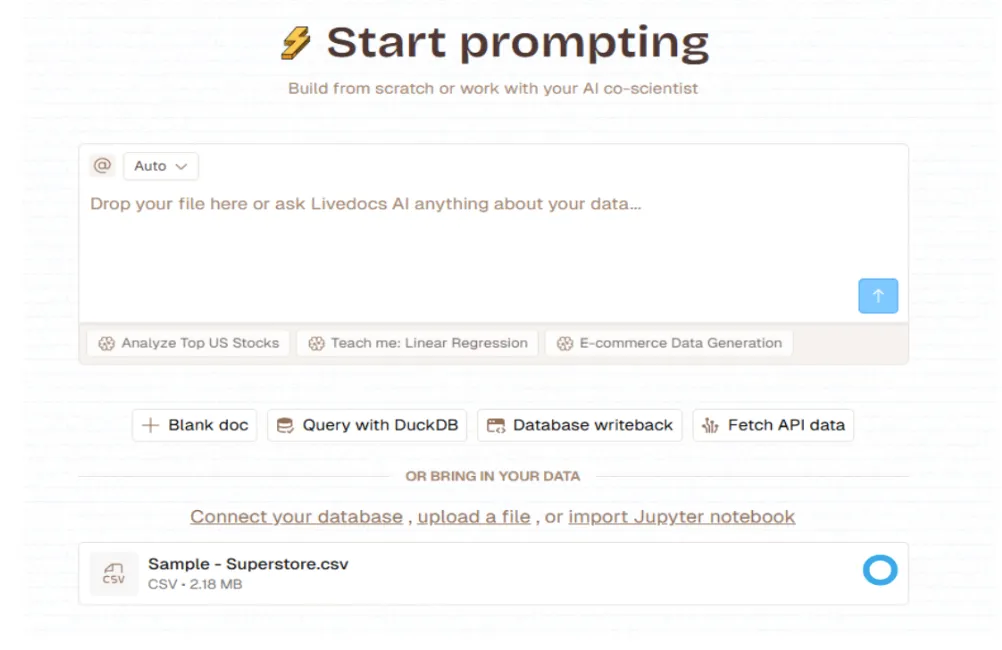
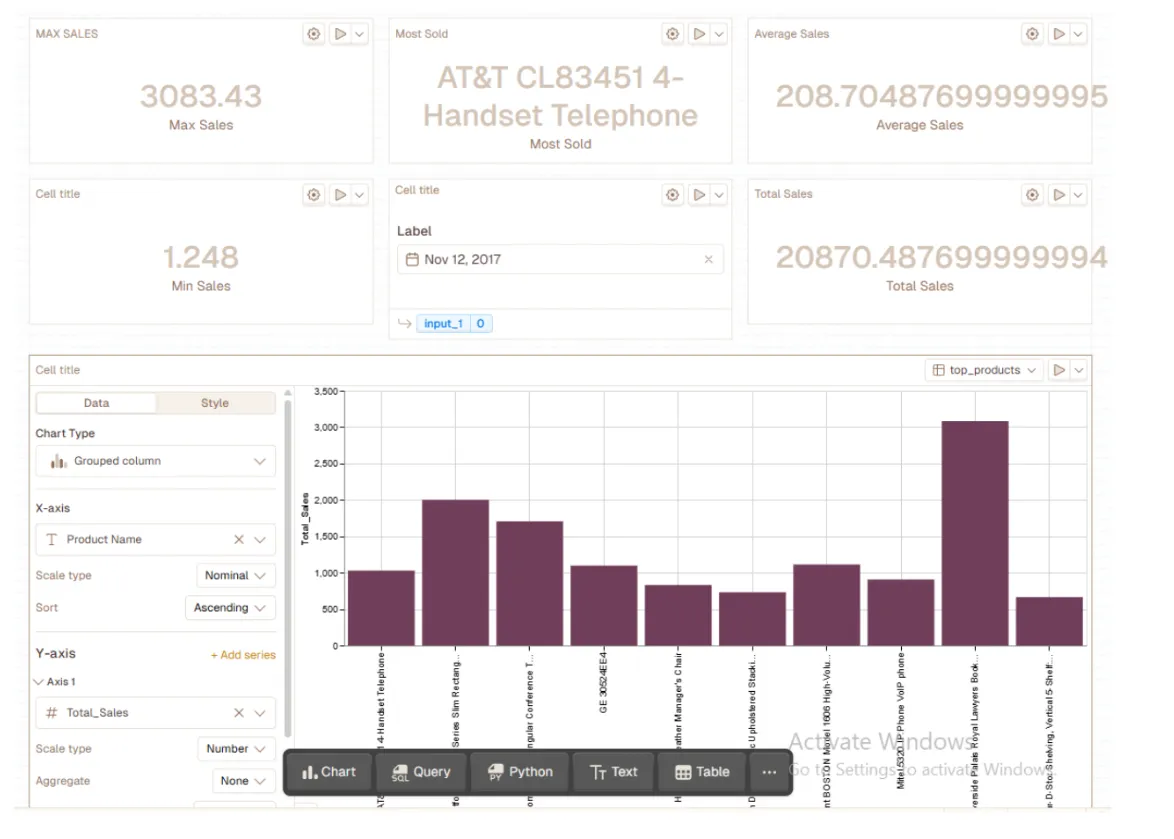
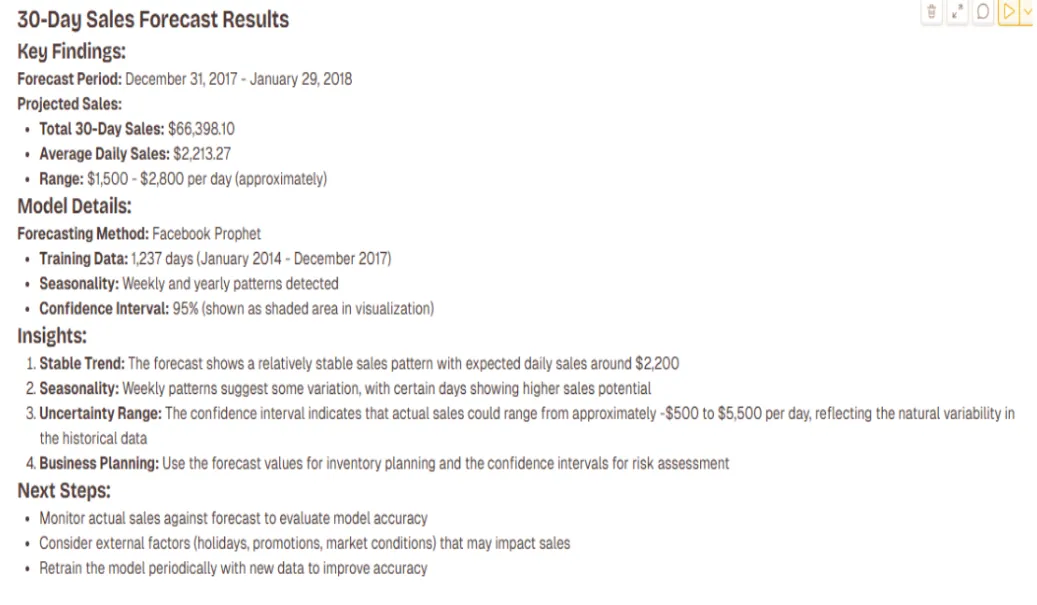
A Step-by-Step Look: Using Livedocss for Finance Data Visualization
Upload and Prepare Your Data(Drag and drop / Upload a file):
Once uploaded, we ask the Livedocs Agent:
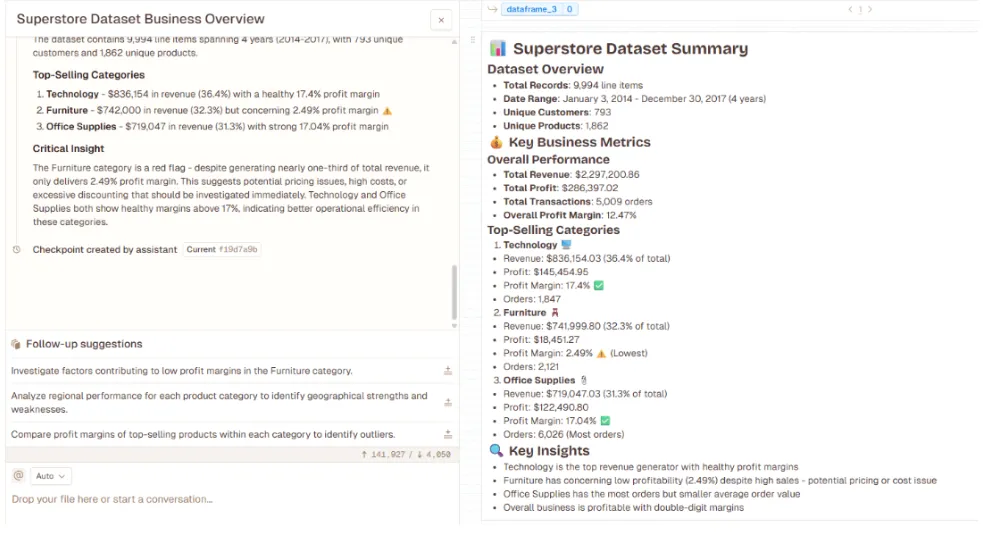
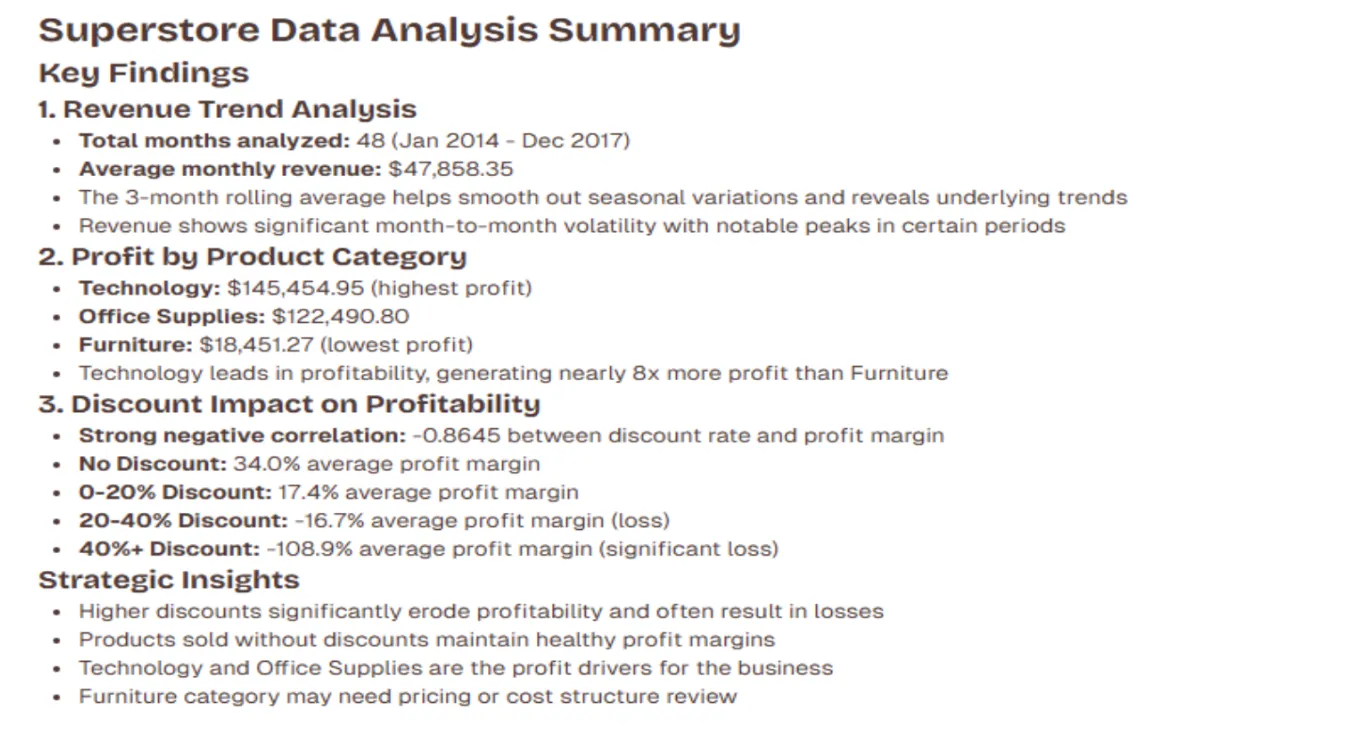
“Summarize the dataset and provide key business metrics: total revenue, total profit, number of transactions, and top-selling categories.”
Livedocs instantly summarizes each column, detects missing values, and displays descriptive statistics such as:
- Average, min, and max scores for Math, Reading, and Writing
- Distribution of genders and parental education levels
- Most common lunch type and preparation course status
This first output helps educators quickly understand the student population and data quality without needing to code.
And the output, the AI Agent provides:
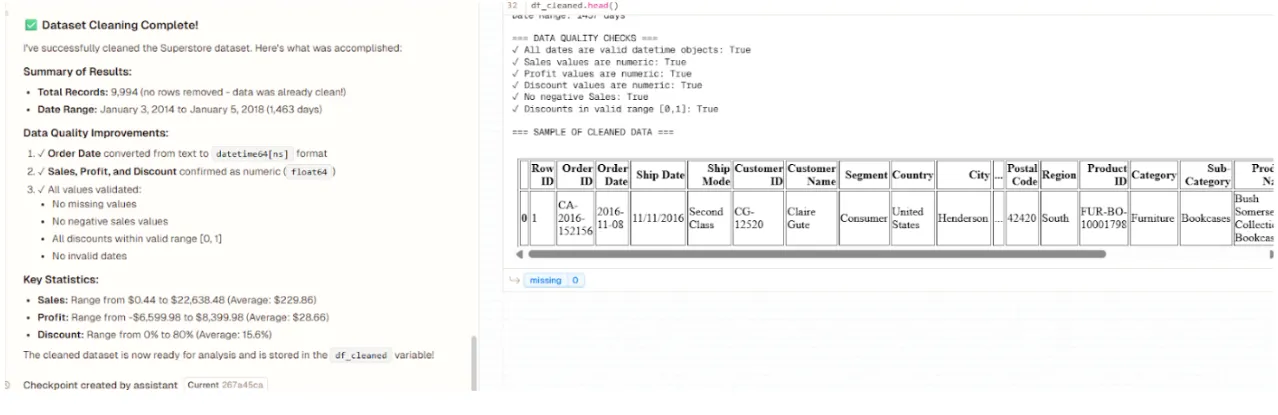
Clean and Validate the Data Automatically
Data typically contains inconsistencies: incorrectly formatted dates, missing values, or non-numeric fields.
Prompt: “Clean the dataset: convert Order Date to datetime, ensure Sales, Profit, and Discount are numeric, and remove any invalid entries.”
The Agent:
- Detects anomalies
- Repairs formatting inconsistencies
- Logs every cleaning step for transparency
Finance teams get clean, analysis-ready data without manual scrubbing.
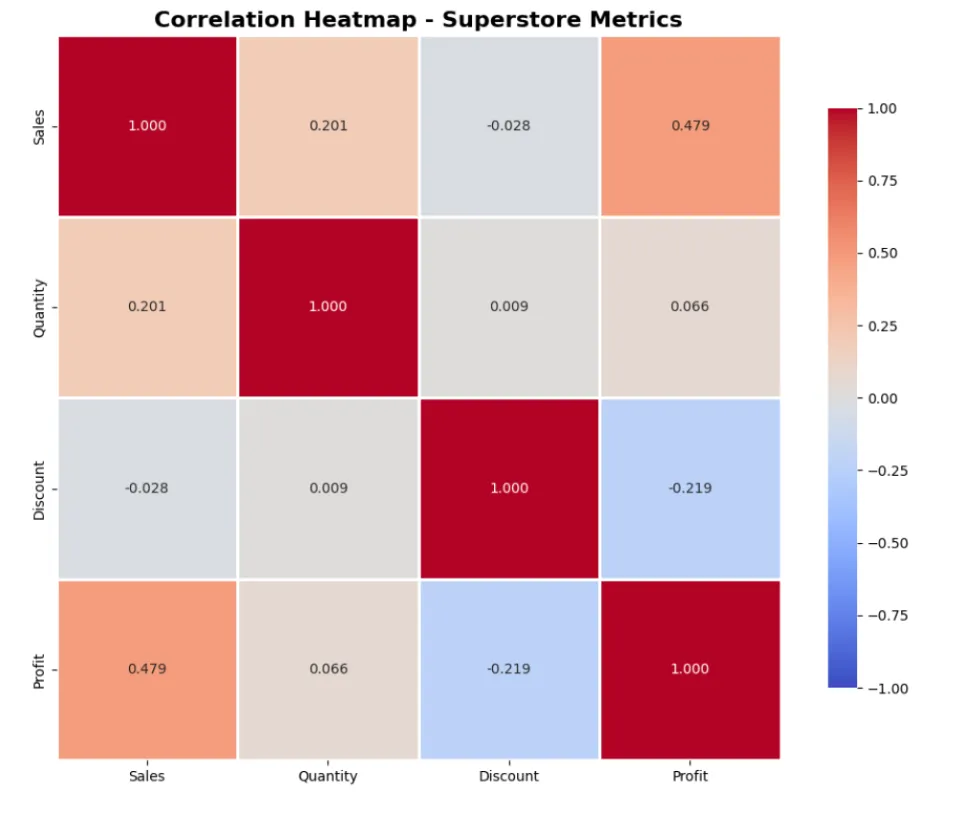
Correlation Summary
A correlation heatmap
Explore Data Visually Using The Data Explorer
Before building dashboards, analysts need to get a feel for the data.
Using Data Explorer, we examine:
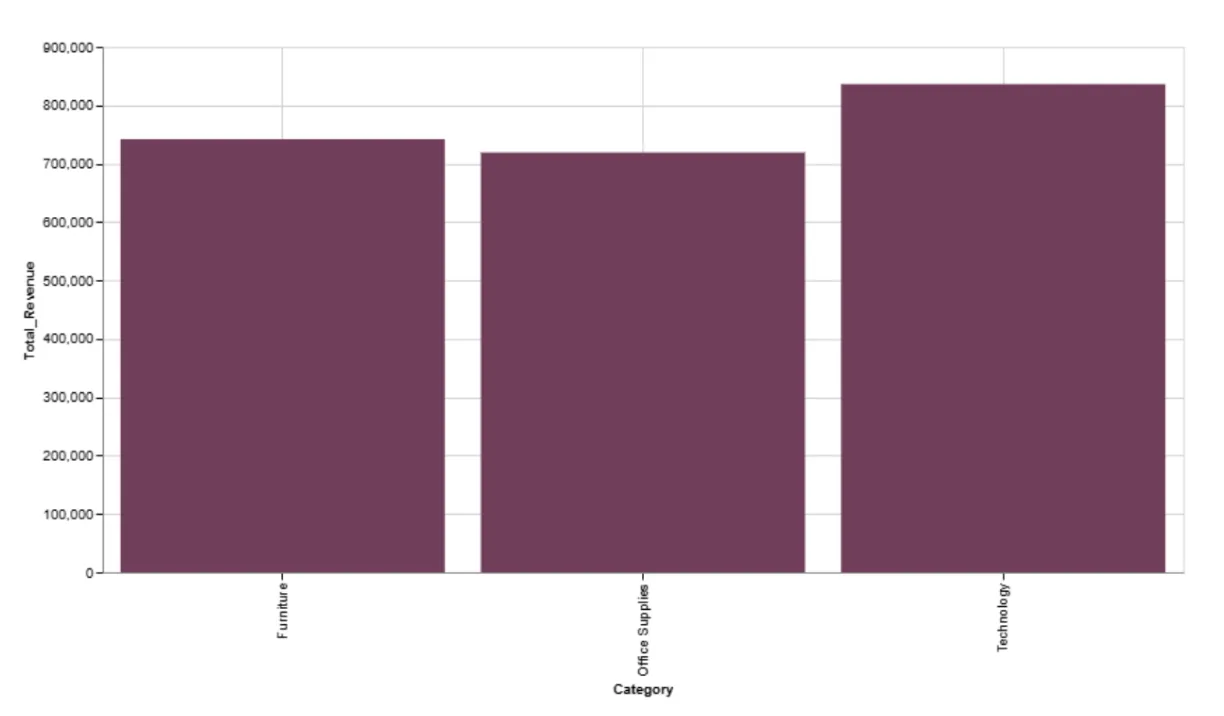
- Which categories generate the highest revenue
- Which regions deliver the best profit margins
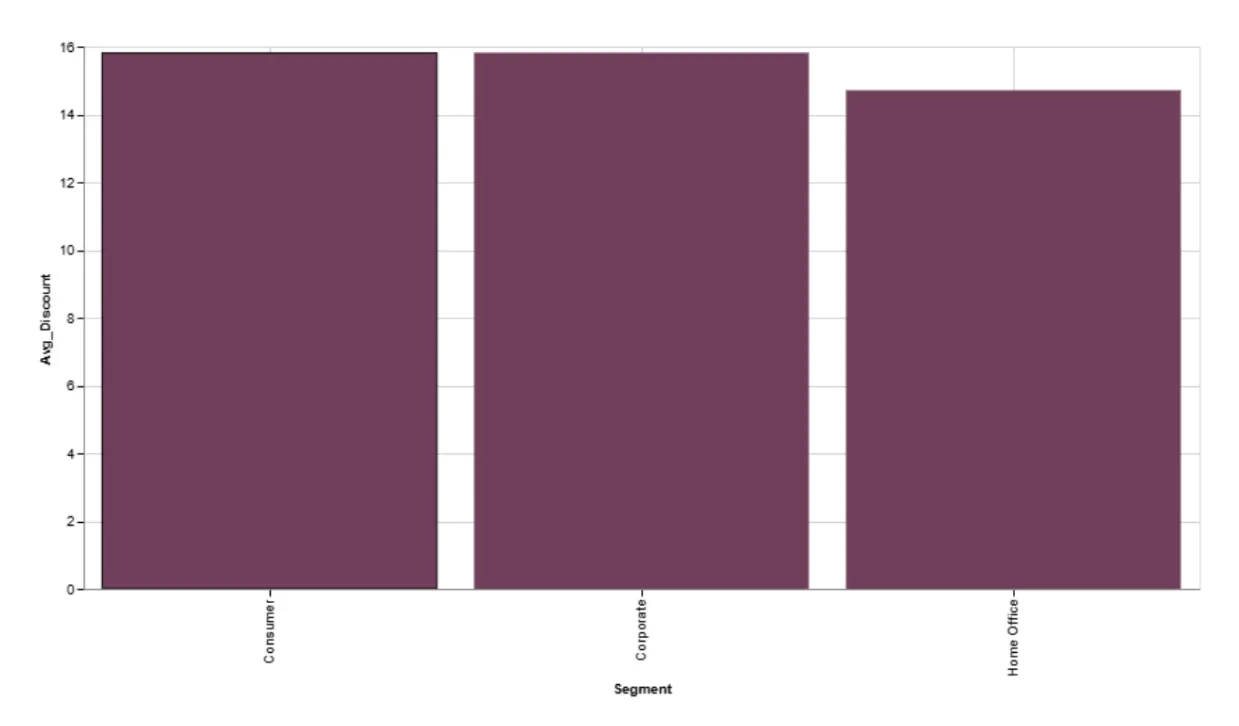
- How discounts vary across segments
Categories Generating Highest Revenue
Regions with Best Profit Margins
Discount Variation Across Segments
This step supports intuition-building — essential for any analyst or finance manager before formal reporting
Recommendations
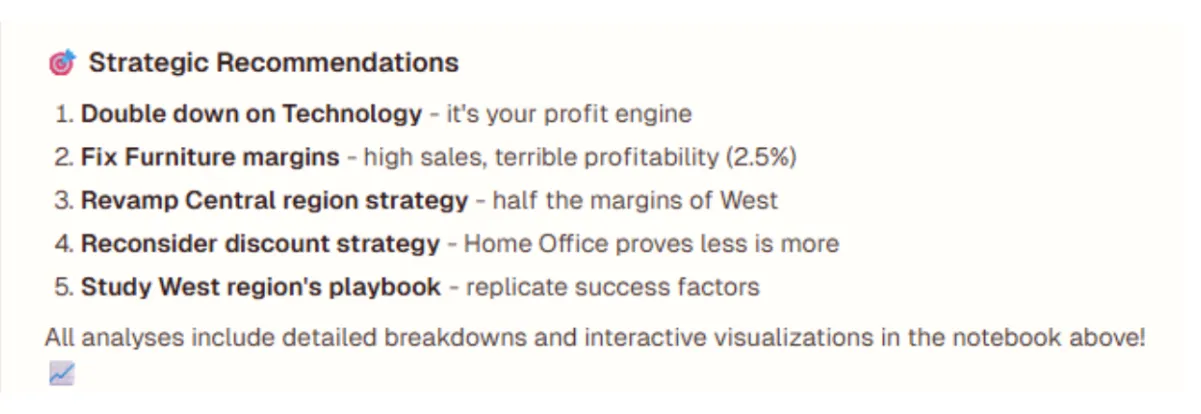
Use Variables to Make the Dashboard Interactive
Here we introduce dynamic inputs that make dashboards reusable and explorable.
Variables we can add:
- Date Range Picker — to analyze different time periods
- Category Dropdown — to filter products
- Minimum Sales Slider — to hide noise & emphasize high-value orders
- Profit Target Input — for benchmark comparison
Example idea:
- If leadership wants to review only High-Value Strategic Products, they can adjust the Minimum Sales slider upward, without touching any code.
This transforms the notebook from a report into an analytics tool.
Compute Derived Business Metrics with a Python Cell
While low-code covers most needs, Python cells provide deeper control when needed — especially for finance metrics we can write our own code.
For example:
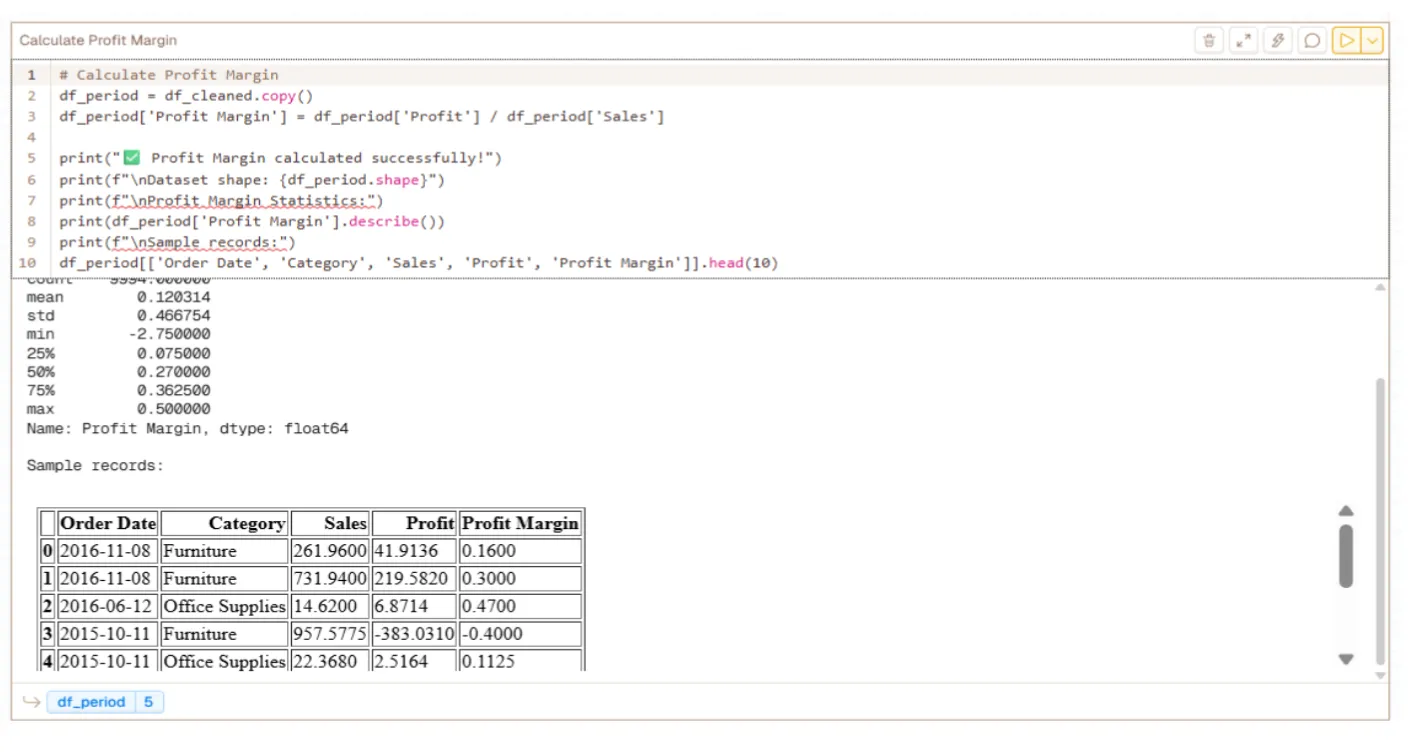
This allows us to study:
- Which products generate high volume but low margins
- Which products generate fewer sales but strong profitability
This analysis is crucial in strategic pricing decisions.
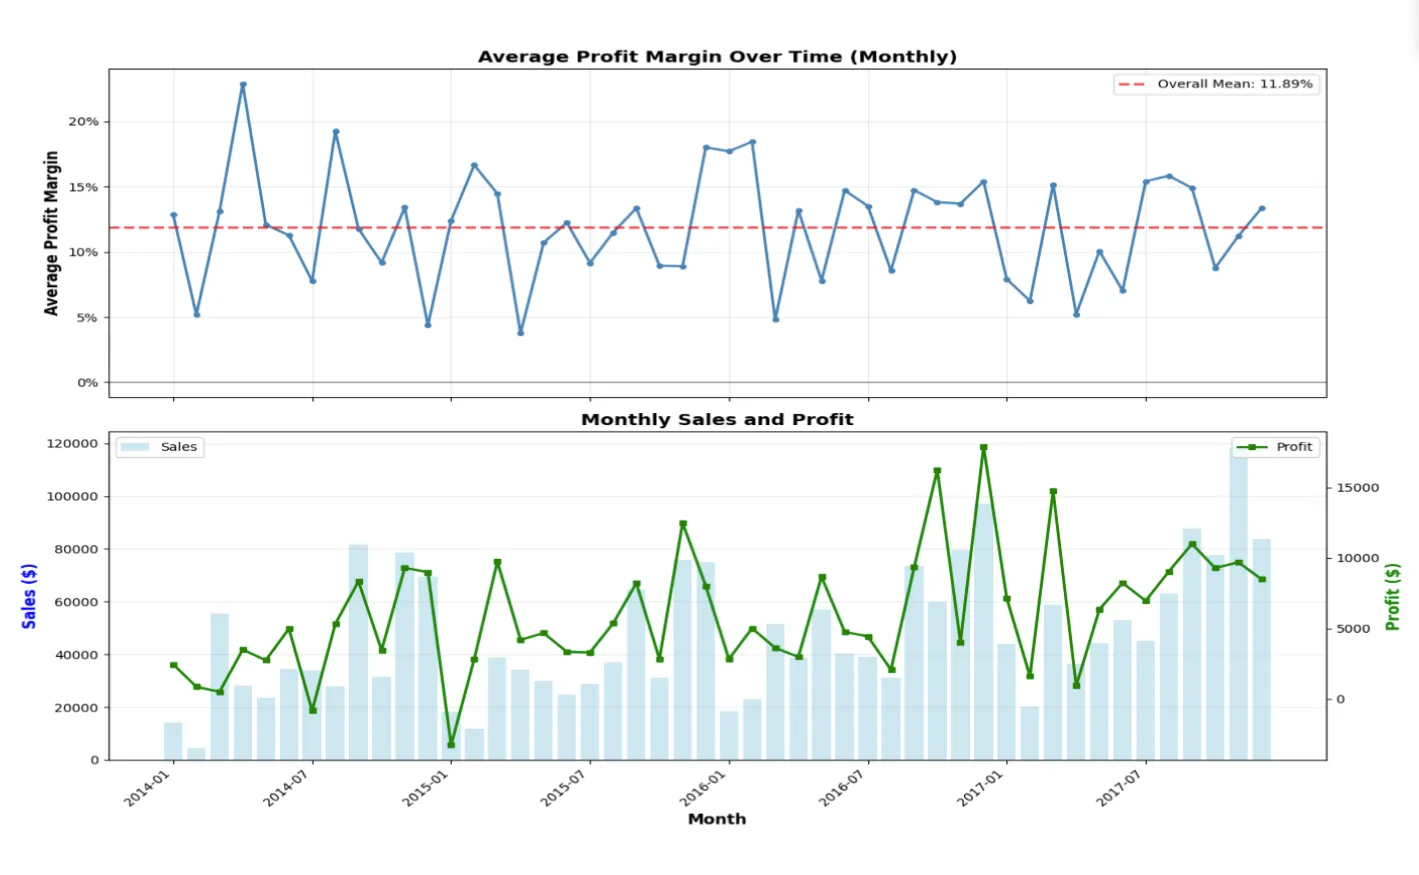
Build Meaningful Financial Visualizations
These visualizations form the core of the financial dashboard:
| Visualisation | Business Question Answered |
|---|---|
| Revenue Trend Over Time | Are we growing or stagnating? |
| Profit by Category | Which product lines matter most? |
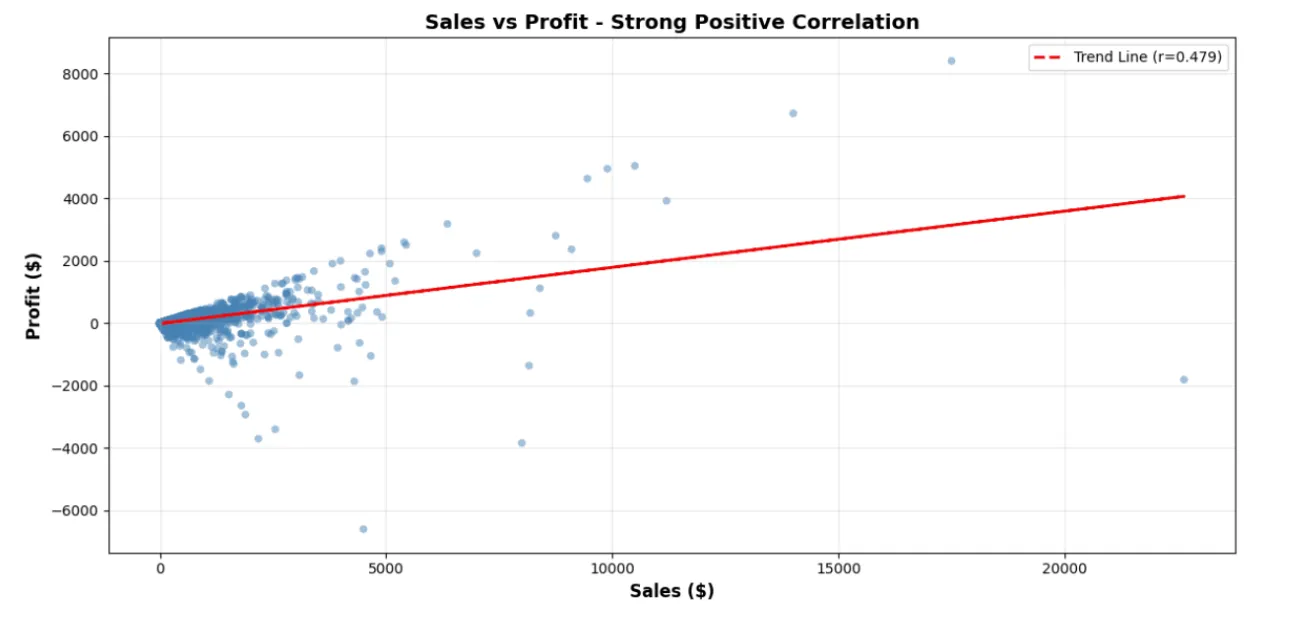
| Discount vs Profit Scatter | Are discounts helping or hurting margins? |
| Region Revenue Comparison | Where should we invest resources? |
Example prompts:
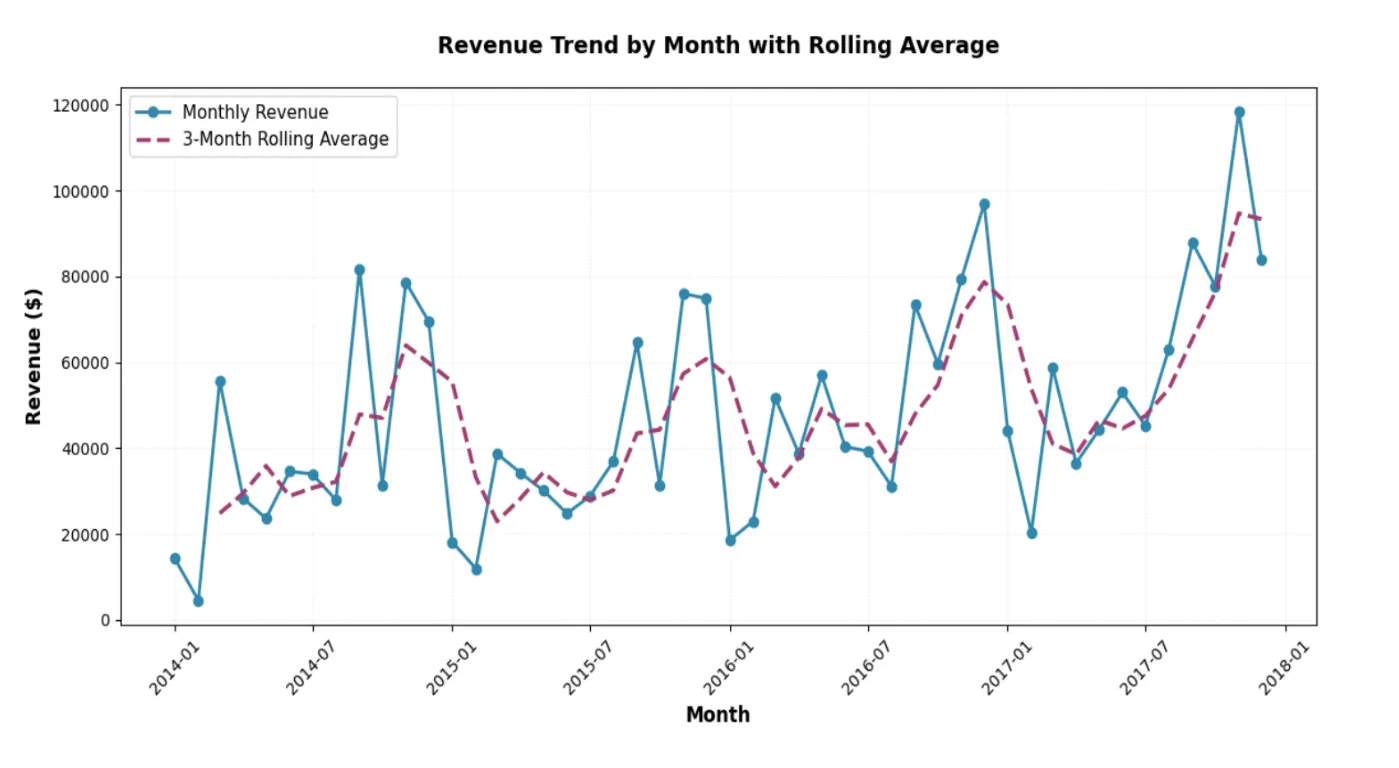
- “Plot revenue trend by month with rolling average.”
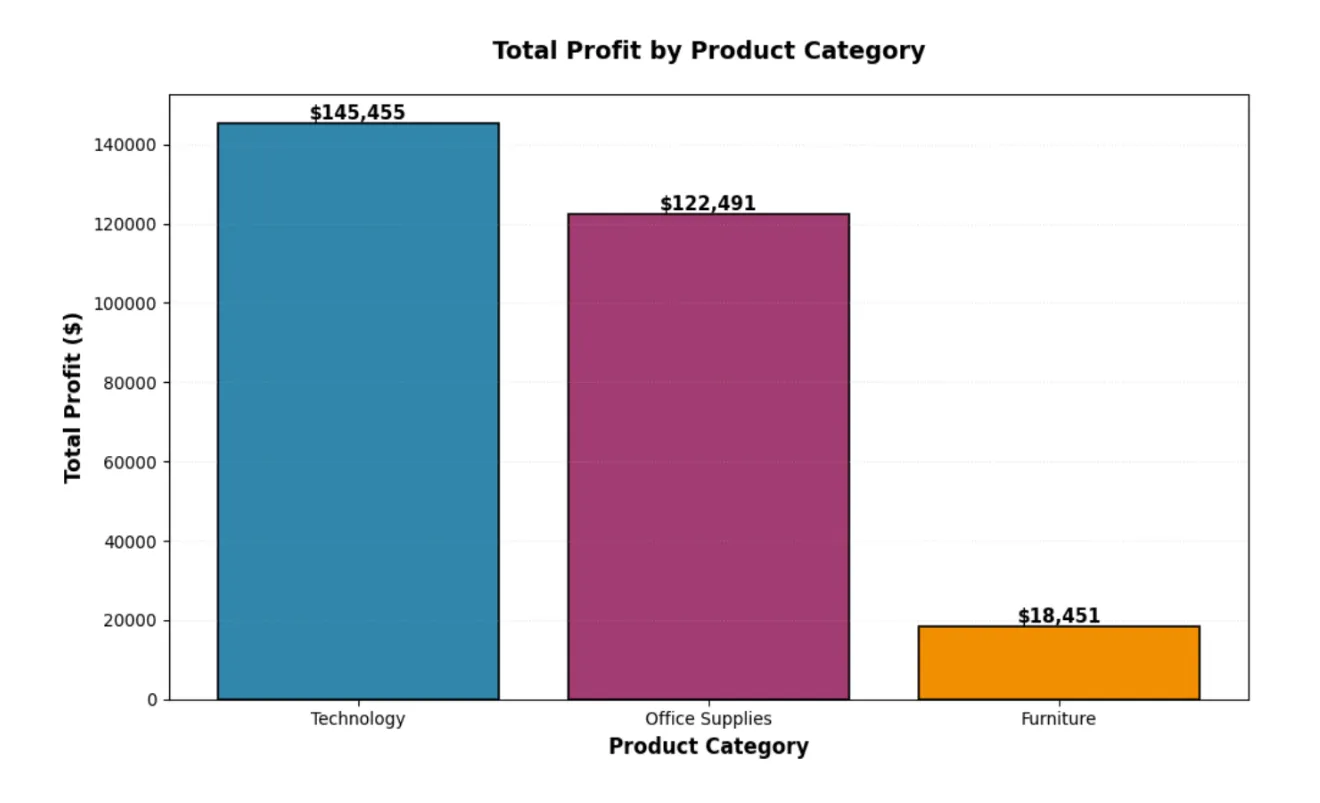
- “Bar chart of total profit by product category.”
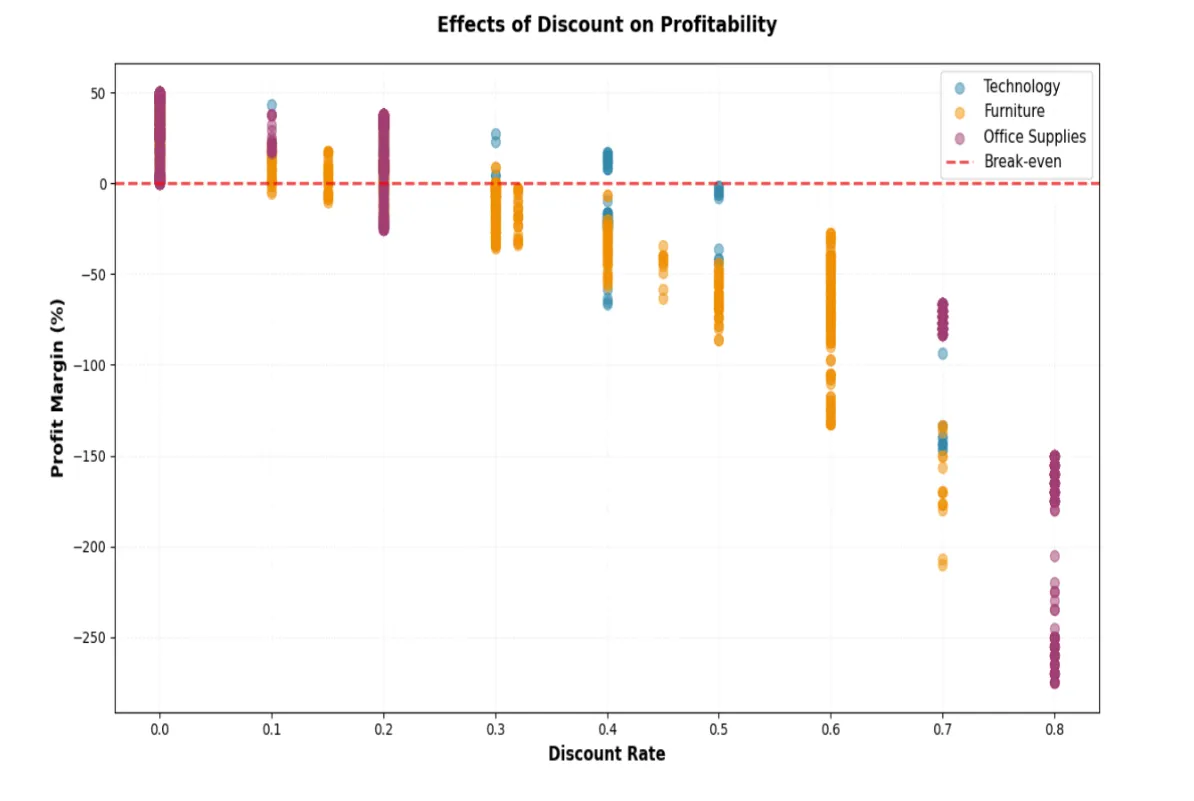
- “Scatter plot showing effects of discount on profitability.”
For example:
Revenue Trend with Rolling Average
Total Profit by Product Category
Discount Effects on Profitability
And the output:
A Workspace Designed for Deep Focus
Built-in Music Stations in Livedocs
In addition to analytical capabilities, Livedocs includes a subtle but thoughtful feature that improves the day-to-day work experience: built-in ambient music environments. When analyzing financial data or preparing dashboards, maintaining focus and clarity is essential — especially during longer sessions.
Livedocs offers curated audio streams inside the workspace, allowing users to choose the mood or productivity style that suits them best:
| Music Mode | Best For | Vibe/Experience |
|---|---|---|
| Symphony Hall | Deep analytical thinking | Soft orchestral music that supports concentration |
| Fred Again.. Radio | Creative workflow & flow-momentum | Energetic, emotional electronic beats for momentum |
| Chill Beats Radio | Calm focused work | Lo-fi beats ideal for steady background focus |
| Livedocs OG | Default workspace ambiance | Balanced neutral soundpsace designed for clarity and long sessions |
These sound modes are especially useful when working on:
- Reviewing financial trends
- Writing final insights and explanations
- Preparing executive summary slides
- Refining dashboards for reporting presentations
Instead of switching between separate browser tabs or distractions, Livedocs allows users to stay in a centered, uninterrupted workflow — enhancing both productivity and comfort.

Forecast Future Revenue with AI Assistance
Prompt:
“Forecast sales for the next 30 days using past revenue data.”
The Livedocs Agent:
- Runs a time-series forecasting model
- Plots forecast curves with confidence intervals
- Generates a short narrative explanation
The Forecast
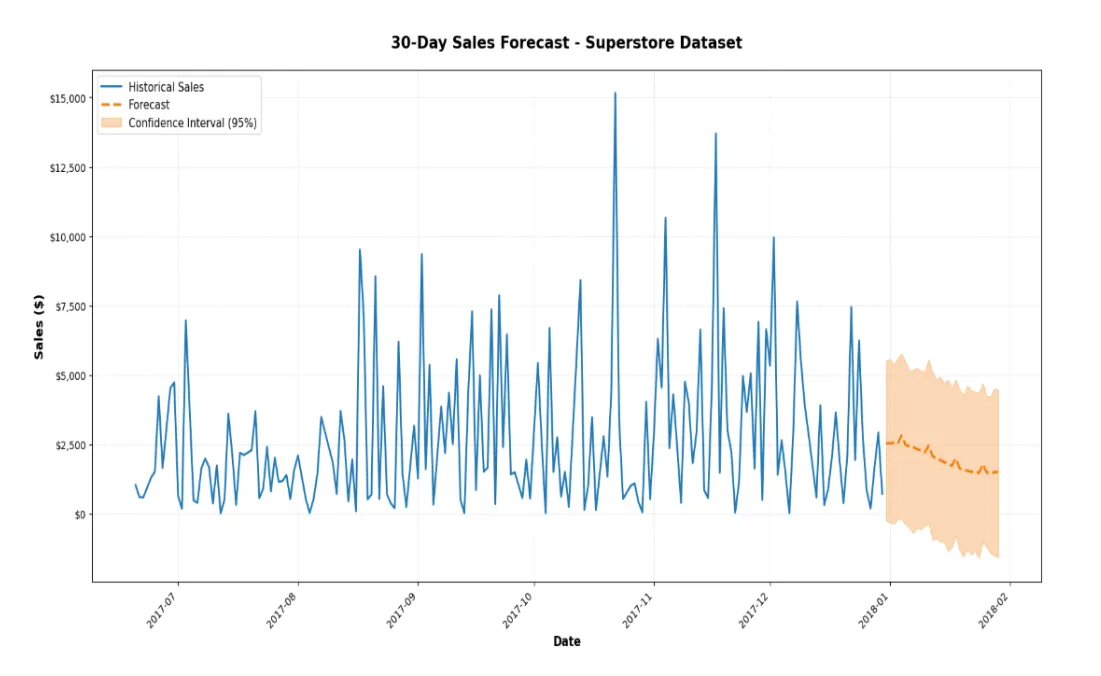
The Explanation
This supports proactive budgeting, staffing, and purchasing decisions rather than reactive tracking.
Automate Reports with Scheduled Runs
Finance teams send reports weekly, monthly, and quarterly.
Prompt:
“Schedule this notebook to run every Monday at 9 AM and email the dashboard PDF to the finance team.”
OR manually set it by ourself:
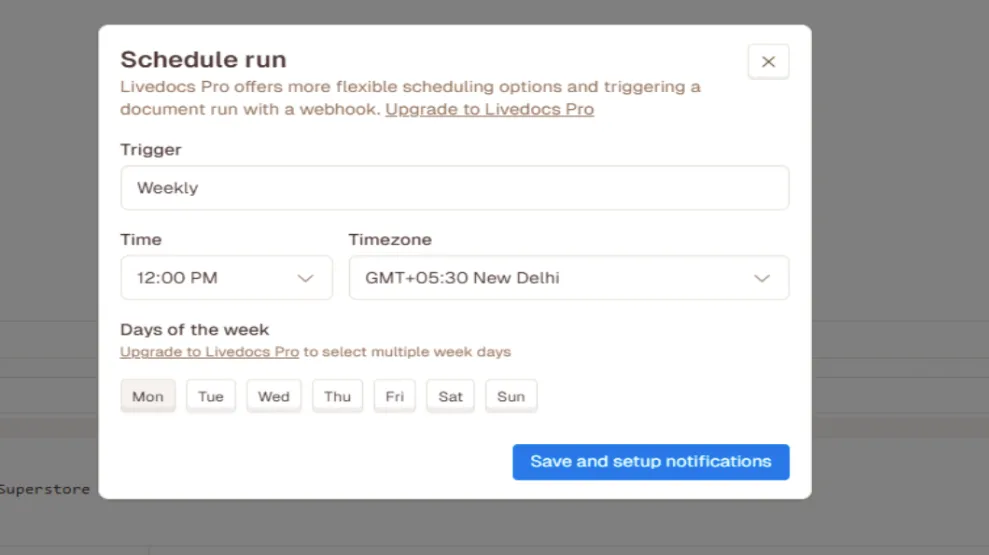
This:
- Eliminates repetitive report creation
- Keeps insights continuously updated
- Ensures leadership is always looking at fresh numbers.
Final Thoughts
Livedocs shifts financial analytics from:
- manual → automated
- static reports → interactive dashboards
- lagging insights → proactive decision support
By combining natural language analytics, interactive controls, forecasting, and automated scheduling, Livedocs lets finance teams operate at strategic speed — without relying heavily on technical analysts or engineers. The result is faster decisions, clearer insights, and more confident leadership.
Key Takeaways
- Finance dashboards can be built without complex BI tools.
- Natural language prompts accelerate analysis significantly.
- Variables turn static reports into dynamic decision systems.
- Python allows customization when depth is required.
- Scheduled runs eliminate repetitive reporting.
The best, fastest agentic notebook 2026? Livedocs.
- 8x speed response
- Ask agent to find datasets for you
- Set system rules for agent
- Collaborate
- And more
Get started with Livedocs and build your first live notebook in minutes.
- 💬 If you have questions or feedback, please email directly at a[at]livedocs[dot]com
- 📣 Take Livedocs for a spin over at livedocs.com/start. Livedocs has a great free plan, with $10 per month of LLM usage on every plan
- 🤝 Say hello to the team on X and LinkedIn
Stay tuned for the next tutorial!
Ready to analyze your data?
Upload your CSV, spreadsheet, or connect to a database. Get charts, metrics, and clear explanations in minutes.
No signup required — start analyzing instantly

