Revenue Analysis 101: Understand Your Number
This is a story of one of our user, who told us he never forget the moment he realized he didn’t actually understand his own business’s finances.

It was year two of running his consulting firm. They’d just closed what he thought was their best quarter ever, twelve new clients, tons of activity, everyone working overtime. he was feeling pretty smug about it all, honestly.
Then his accountant sent him the quarterly report.
Revenue was up 40%! But profit? Down 15%.
That’s when it hit him: they’d been so focused on bringing money in that they’d completely ignored what was going out. He didn’t understand the difference between revenue and profit. He couldn’t explain why they were busier than ever but less profitable. And he definitely couldn’t tell you which clients or services were actually making us money.
Turns out, three of those twelve his new clients were barely breaking even once he factored in the time we spent servicing them. They were literally working harder to make less.
That embarrassing wake-up call sent him down the rabbit hole of revenue analysis.
Most business owners, even successful ones are flying blind when it comes to truly understanding their revenue. So let’s fix that. This is your crash course in revenue analysis, minus the jargon and the judgment.
And you can simply done your revenue analysis with Livedocs. Livedocs is an advanced AI agent for data analysis, from question to result in seconds.
What Revenue Actually Means
Let’s start with the basics, because this trips up more people than you’d think.
Revenue is simply the total amount of money your business earns from selling goods or services during a specific period. That’s it. It’s the money coming in before you pay for anything, salaries, rent, supplies, coffee etc.

The formula couldn’t be simpler:
Revenue = Quantity Sold × Selling Price
If you sell 100 widgets at $50 each, your revenue is $5,000. Easy enough, right?
But here’s where people stumble: revenue is not the same as profit. Not even close.
Revenue is often called the “top line” because it sits at the top of your income statement. It’s the starting point, not the finish line. Profit, the “bottom line”, is what’s left after you subtract all your expenses from that revenue.
Think of it this way: if revenue is all the money flowing into your bucket, profit is what stays in the bucket after you’ve paid all your bills and obligations. You can have a huge bucket (high revenue) but tiny profits if there are holes everywhere (high expenses).
I’ve seen businesses pull in millions in revenue while barely scraping by on profit margins. I’ve also seen smaller businesses with modest revenue that are incredibly profitable because they’ve got their costs under control.
Both numbers matter, but they tell very different stories.
Types of Revenue You Need to Know
Not all revenue is created equal. Understanding the different types helps you see where your money’s really coming from.
Operating Revenue
This is your bread and butter, the money you make from your core business activities. For a bakery, it’s selling bread and pastries. For a software company, it’s subscription fees. For a consulting firm like mine, it’s client billable hours.
Operating revenue is what you should care about most because it reflects your actual business performance. It’s predictable, repeatable, and shows whether your business model works.
Non-Operating Revenue
This is the side hustle money, income from activities that aren’t your main gig. Examples include:
- Interest earned on your business savings account
- Selling old equipment or assets
- Rental income from property you own but don’t actively manage
- One-time gains from investments
Non-operating revenue is nice to have, but it’s unreliable. You can’t build a business strategy around your savings account interest or that one-time sale of used office furniture.
Smart investors and analysts strip out non-operating revenue when evaluating a business because it doesn’t tell them much about whether your core operations are healthy.
Recurring vs. Non-Recurring Revenue
Here’s another critical distinction: recurring revenue comes in regularly (monthly subscriptions, annual contracts, retainer fees), while non-recurring revenue is one-off (project work, single purchases, consulting gigs).
Recurring revenue is gold. It’s predictable, which makes planning easier. You wake up knowing roughly what’s coming in this month. Non-recurring revenue is spikier, great when it hits, scary when it doesn’t.
Businesses with high recurring revenue (SaaS companies, subscription boxes, gym memberships) have an easier time forecasting and planning than businesses dependent on one-time sales.
The Building Blocks of Revenue Analysis
Okay, so you know what revenue is. Now what? How do you actually analyze it in a way that helps you make better decisions?
Revenue analysis is the process of examining your revenue data to understand patterns, identify opportunities, and spot problems before they become disasters. Let me walk you through the key components.
Revenue Trends Over Time
The most basic question: is your revenue going up, down, or staying flat?
You track this by comparing revenue across different periods, month over month (MoM), quarter over quarter (QoQ), or year over year (YoY). Looking at these trends helps you understand if you’re growing, declining, or plateauing.
But, and this is important, don’t just look at the numbers in isolation. Context matters.
If your revenue dipped 20% in January, that might be alarming. Unless you run a tax preparation business, in which case January is always slow and April is your boom month. That’s seasonality, and it’s completely normal for many businesses.
When analyzing trends, ask yourself:
- Are there seasonal patterns I should account for?
- Did external factors (economic conditions, new competitors, market shifts) influence the numbers?
- Are my trends consistent across different products or customer segments?
Revenue by Source
Where’s your money actually coming from? This matters more than you think. Break down your revenue by:
- Product or service line (Which offerings are winners? Which are duds?)
- Customer segment (Are enterprise clients or small businesses driving growth?)
- Geographic region (Is one location massively outperforming others?)
- Sales channel (Online, in-store, through partners?)
I once worked with a retail business that assumed their in-store sales were the bread and butter. When we actually analyzed the numbers, their online store was generating 60% of revenue with half the overhead. That insight completely changed their investment strategy.
Customer Revenue Metrics
Your customers aren’t all worth the same amount. Some are incredible; others are barely worth the effort. Key metrics to track:
- Average Revenue Per User (ARPU): Total revenue ÷ Number of customers
- Customer Lifetime Value (CLV): Average revenue per customer × Average customer lifespan
- Revenue concentration: What percentage of your revenue comes from your top 20% of customers?
If you discover that 80% of your revenue comes from just three clients, that’s valuable information, and a potential risk. What happens if one leaves?
How to Actually Conduct a Revenue Analysis (Step by Step)
Alright, enough theory. Let’s get practical. Here’s how you conduct a solid revenue analysis without needing an MBA or fancy software (though tools help, and we’ll get to that).
Step 1: Gather Your Data
You need reliable numbers first. Pull data from:
- Your accounting software (QuickBooks, Xero, NetSuite, whatever you use)
- Your payment processor (Stripe, Square, PayPal)
- Your CRM or sales system
- Any other tools where transaction data lives
Make sure you’re comparing apples to apples. If you’re looking at Q1 2024 vs. Q1 2023, both datasets should use the same accounting method and include the same types of revenue.
Step 2: Calculate Your Core Metrics
Start with the basics:
- Total Revenue: Add up all income from sales and services for your chosen time period.
- Gross Revenue: Total revenue before any deductions (returns, discounts, allowances).
- Net Revenue: Gross revenue minus returns, discounts, and allowances. This is your “real” revenue, what you actually kept.
- The formula: Net Revenue = Gross Revenue - Returns - Discounts - Allowances
For example, if you had $100,000 in gross sales but gave $5,000 in discounts and accepted $3,000 in returns, your net revenue is $92,000.
Step 3: Look for Patterns and Trends
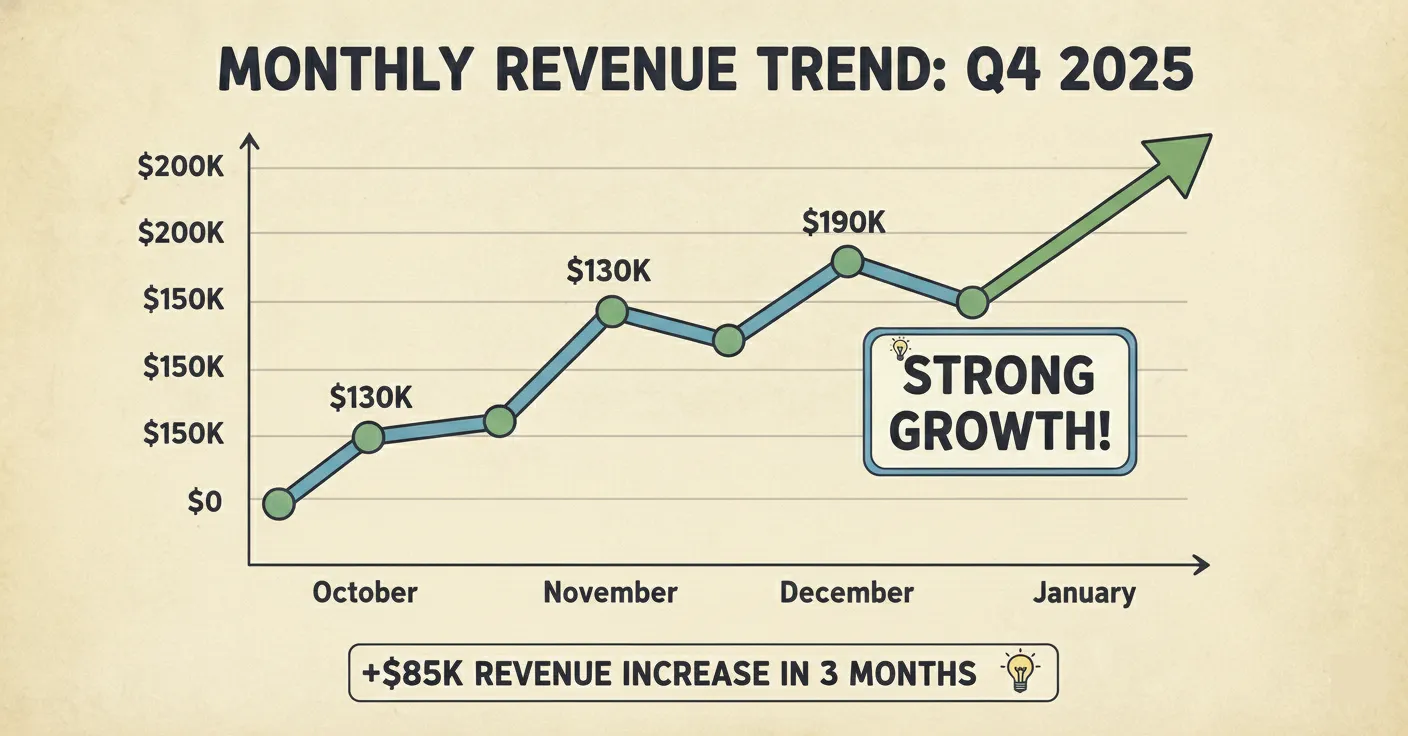
Plot your revenue on a graph over time. What do you see?
- Upward trend: Revenue growing consistently? Great, but ask why. Is it more customers, higher prices, or both?
- Downward trend: Revenue declining? Figure out the cause quickly. Lost customers? Lower average transaction values? Increased competition?
- Flat trend: Stagnant revenue might mean you’ve hit a plateau. Time to think about expansion or new offerings.
- Seasonal patterns: Spikes and dips that repeat each year? That’s seasonality, and you should plan for it.
Step 4: Segment Your Analysis
Don’t just look at total revenue, break it down. Compare revenue across:
- Different products or services
- Customer types or segments
- Sales channels
- Geographic regions
- Time periods
This granular view reveals where your real opportunities and problems hide. Maybe Product A is declining while Product B is skyrocketing. That’s actionable insight.
Step 5: Calculate Revenue Growth Rate
Want to know if you’re actually growing? Calculate your revenue growth rate.
Revenue Growth Rate = [(Current Period Revenue - Previous Period Revenue) / Previous Period Revenue] × 100
If you made $80,000 last quarter and $100,000 this quarter:
Growth Rate = [($100,000 - $80,000) / $80,000] × 100 = 25%
That’s solid growth. But now compare it to industry benchmarks, is 25% good for your sector? Are competitors growing faster?
Step 6: Pair Revenue with Profitability
Remember my earlier mistake? Revenue without profit context is dangerous. For each revenue stream, calculate:
Gross Margin: (Revenue - Cost of Goods Sold) / Revenue
Net Margin: Net Income / Revenue
You might discover that your highest-revenue product has terrible margins, while a smaller product line is incredibly profitable. That changes everything about where you invest resources.
Common Revenue Analysis Mistakes
Let me save you some pain by highlighting the mistakes I’ve seen (and made).
Mistake #1: Ignoring Returns and Discounts
Gross revenue looks impressive, but if you’re giving away 30% in discounts and dealing with high return rates, your net revenue tells a different story.
Always analyze net revenue. It’s the honest number.
Mistake #2: Not Accounting for Timing
This is huge in accrual accounting. You might record revenue in March when you invoice a client, but they don’t pay until May. Your revenue looks great, but your cash flow is suffering.
Track both revenue (when earned) and cash flow (when received). They’re different, and both matter.
Mistake #3: Comparing the Incomparable
Don’t compare January (post-holiday slump) to December (peak shopping season) and freak out about the difference. Compare January 2025 to January 2024 for a fair assessment.
Mistake #4: Analyzing in a Vacuum
Revenue doesn’t exist in isolation. External factors matter:
- Economic downturns
- New competitors entering your market
- Regulatory changes
- Seasonal trends
- One-off events (hello, pandemic)
If your revenue dropped but so did everyone else’s in your industry, that’s different than if you’re the only one struggling.
Mistake #5: Focusing Only on Total Revenue
Averages hide problems. If total revenue is up but you lost half your customers and the remaining ones just bought more, that’s a red flag, not a success story.
Segment your data. Look at customer counts, average transaction values, and purchase frequency separately.
Making Your Revenue Analysis Actionable
Analysis without action is just numbers in a spreadsheet. Here’s how to turn insights into strategy.
If Revenue Is Growing:
Don’t just celebrate, figure out why.
- Which products or services are driving growth?
- Which customer segments are expanding?
- What marketing or sales activities correlate with the increase?
Double down on what’s working. If your online channel is crushing it, invest more there.
If Revenue Is Declining:
Time for damage control.
- Are you losing customers, or are existing customers spending less?
- Is the problem isolated to one product, region, or channel?
- What changed between now and when things were going well?
Address the root cause. If it’s customer churn, focus on retention. If it’s pricing, reassess your strategy.
If Revenue Is Flat:
Stagnation is dangerous, it often precedes decline.
- Are you reaching market saturation?
- Have competitors taken market share?
- Do you need new products or services?
- Should you expand to new markets or customer segments?
Flat revenue requires innovation. You can’t keep doing the same thing and expect different results.
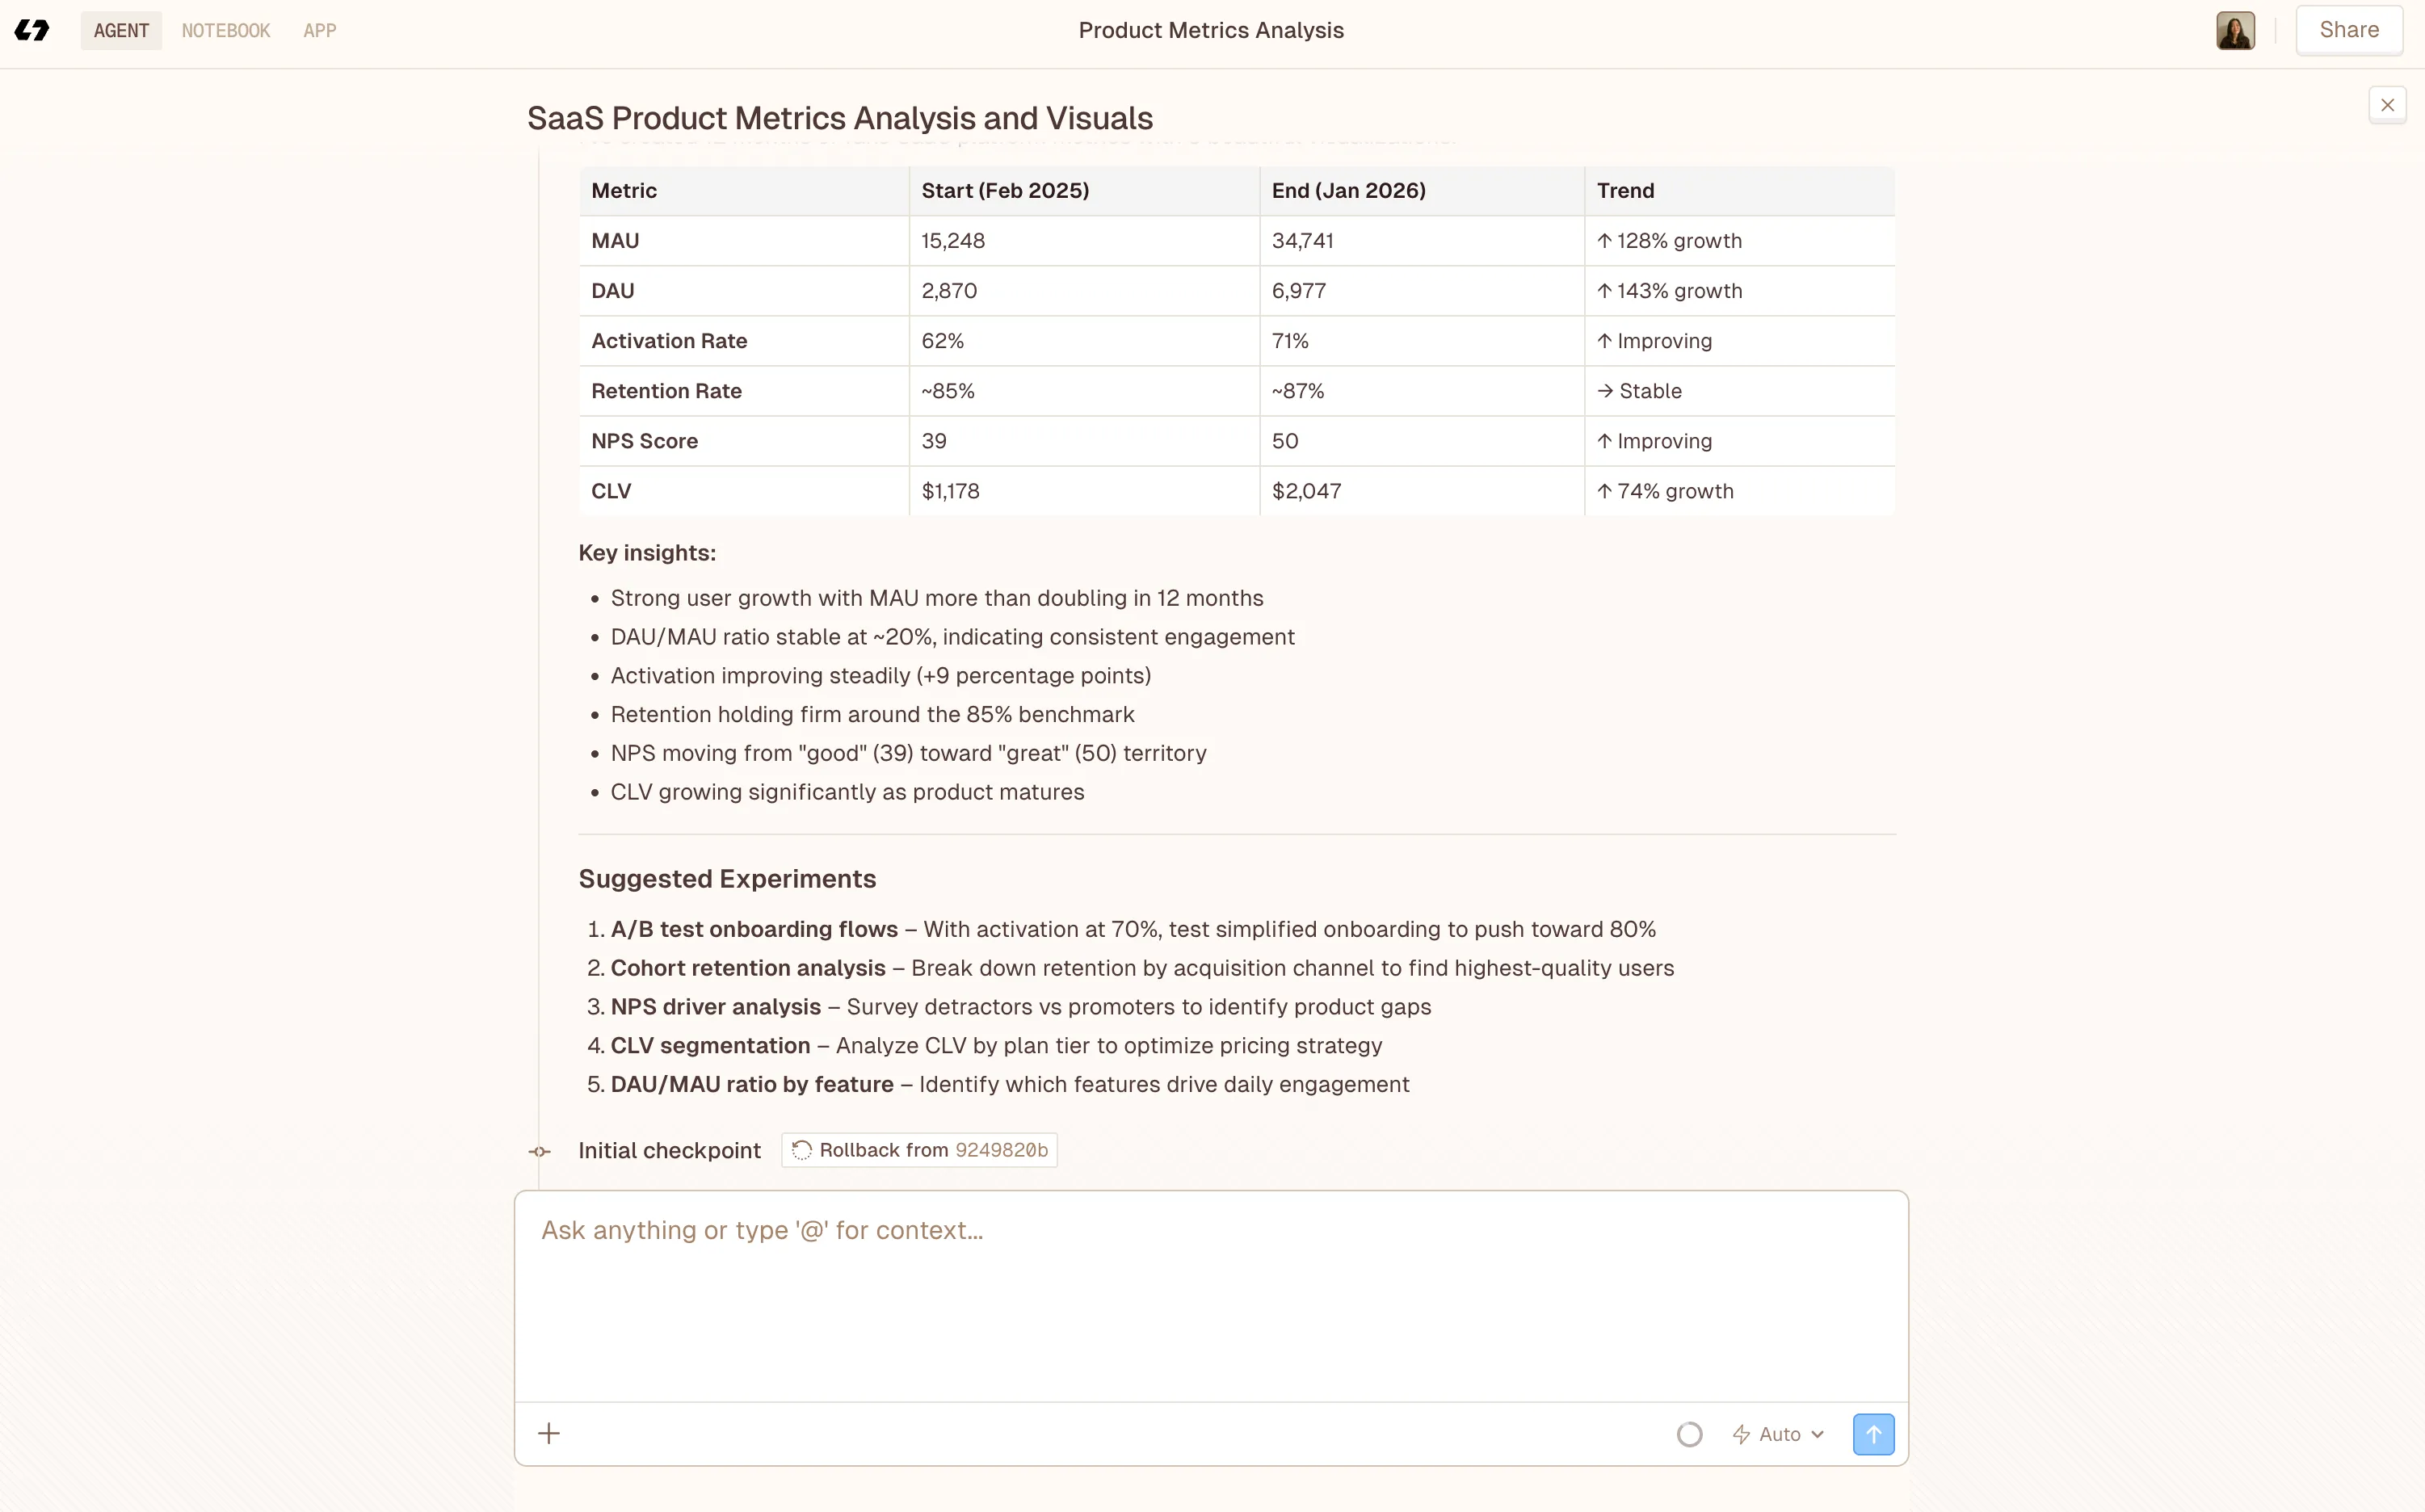
How Livedocs Makes Revenue Analysis Actually Manageable
Look, I’m going to be straight with you: doing all this analysis manually is exhausting.
You’re pulling data from your accounting software, exporting CSVs, building spreadsheets, creating charts, and then, best part, doing it all again next month when the data’s outdated.
There’s a better way.
Livedocs solves the exact problem I had when I realized I didn’t understand my revenue: scattered data and static reports that were obsolete the moment I created them.
Here’s how it helps with revenue analysis specifically:
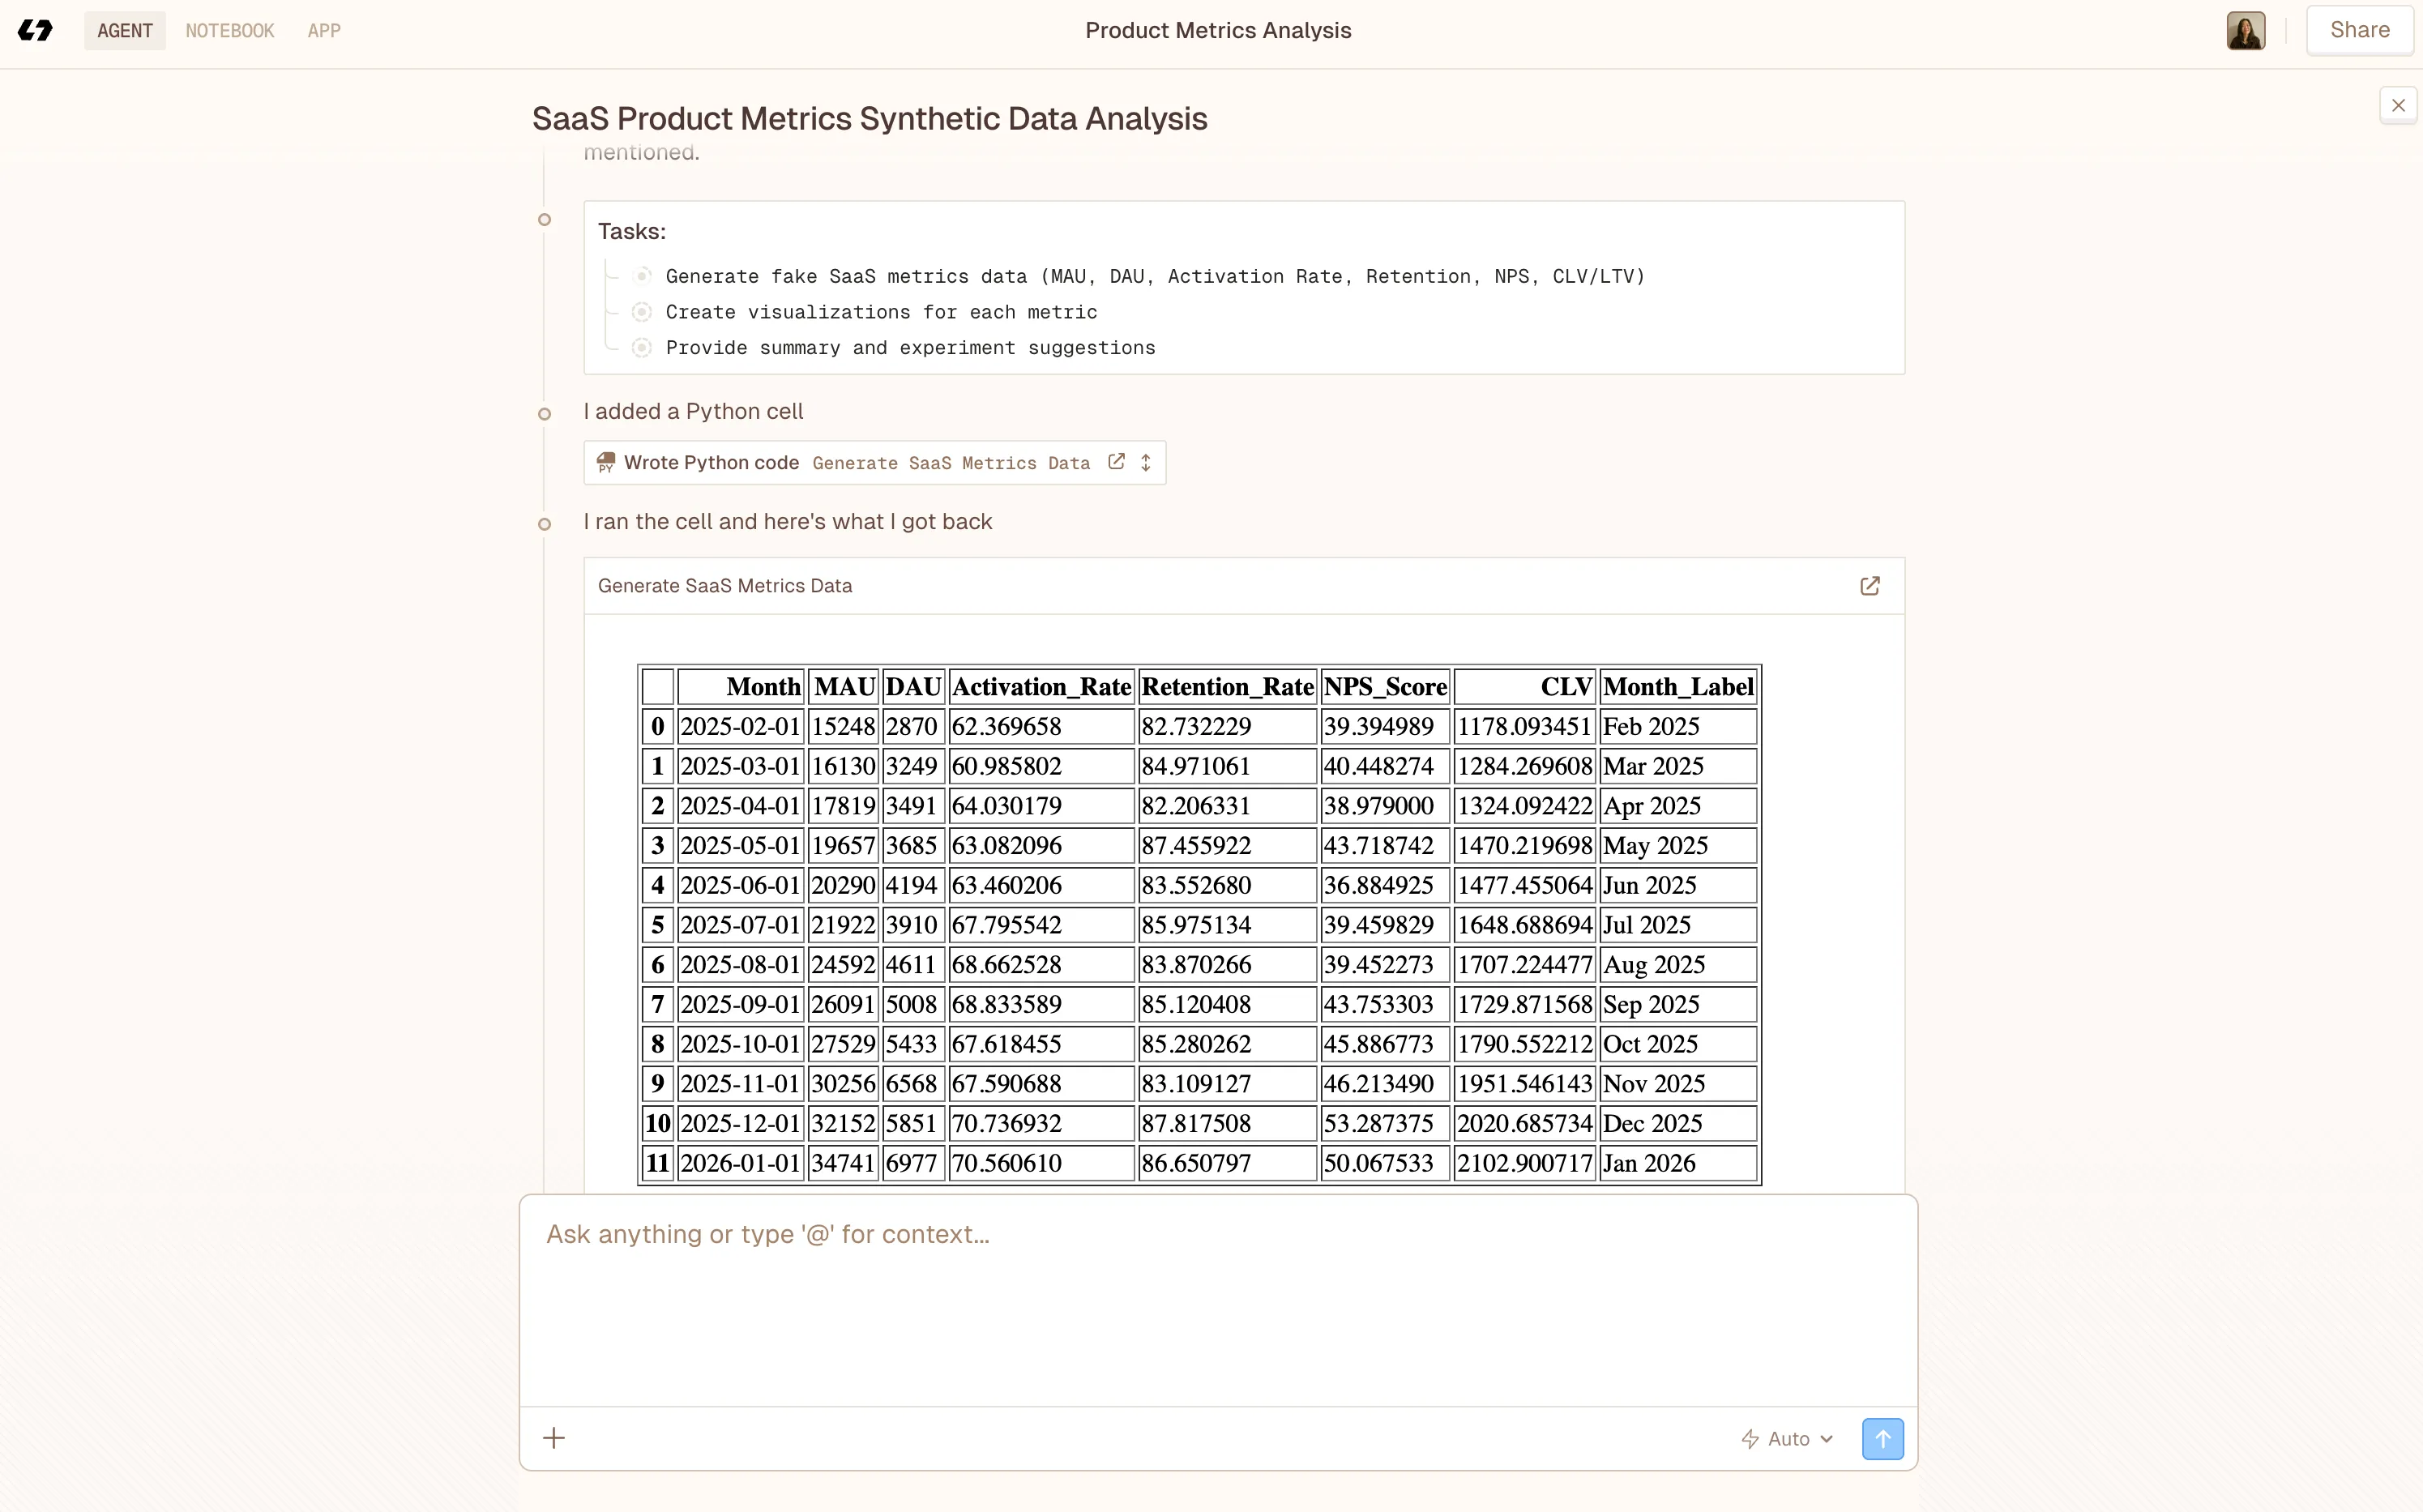
Live data connections
Instead of manually exporting data from QuickBooks, NetSuite, Stripe, or wherever your financial data lives, Livedocs pulls it automatically. Your revenue reports update in real-time without you touching anything.
All your metrics in one place
Revenue by product, revenue by customer segment, growth rates, trends, instead of juggling multiple tools and spreadsheets, you can build one comprehensive document that shows everything you need to understand your revenue story.
Context + data together
This is the killer feature for revenue analysis. You can put your numbers right next to your strategic thinking. Show January revenue dropped 15%, then immediately explain “This is expected seasonality, our tax prep services always dip post-season.” The data and the narrative live together, which makes actual sense.
No technical skills required
You don’t need to know SQL or become a data analyst. Livedocs uses AI to help you generate the charts and metrics you need. Just describe what you want to see, and the tool builds it.
For business owners and finance teams who aren’t data experts, which is most of us, this is huge. You can focus on running your business instead of becoming a spreadsheet wizard.
The practical impact? Instead of spending hours each month building reports, you spend minutes interpreting insights and making decisions. Your revenue analysis stays current, and you can share it with stakeholders who see the same live data you’re seeing.
Advanced Revenue Analysis Techniques
Once you’ve mastered the basics, these techniques add another layer of insight.
Cohort Analysis
Group customers by when they first purchased (or any shared characteristic) and track their revenue contribution over time. You might discover that customers acquired through organic search have 50% higher lifetime value than customers from paid ads.
That’s powerful information for allocating your marketing budget.
Revenue Concentration Analysis
Calculate what percentage of your revenue comes from your top 10%, 20%, and 50% of customers.
High concentration (like 80% of revenue from 10% of customers) signals risk. If a major client leaves, your revenue takes a massive hit. It also signals opportunity, maybe you can replicate what made those top customers so valuable.
Pareto Principle Application
The 80/20 rule applies to revenue too. Often, 80% of your revenue comes from 20% of your products or 20% of your customers. Identify that crucial 20% and protect it fiercely. Nurture those relationships, invest in those products, and understand what makes them successful.
Forecasting Future Revenue
Use historical data to predict future performance. This gets sophisticated quickly (regression analysis, time series forecasting), but even basic extrapolation helps. If you’ve grown 5% quarterly for the past two years, you can reasonably project similar growth, barring major market changes.
Revenue Per Employee
Divide total revenue by number of employees. This efficiency metric shows how productively you’re using your human capital. If your revenue per employee is declining while headcount grows, you might be overstaffed or not generating enough value from each team member.
Putting It All Together
Here’s the routine I recommend for most businesses:
Weekly
Quick check of current week’s revenue vs. targets. Just a pulse check, nothing fancy.
Monthly
Comprehensive revenue analysis comparing current month to:
- Previous month
- Same month last year
- Your budget/target
Break down by product, customer segment, and channel. Look for anomalies and trends.
Quarterly
Deep analysis including:
- Revenue growth rates
- Margin analysis
- Customer metrics (ARPU, CLV)
- Forecasting for next quarter
- Strategic adjustments based on trends
Annually
Big-picture review:
- Full-year performance vs. goals
- Multi-year trends
- Strategic planning for next year
- Budget setting based on realistic revenue projections
Adjust this cadence to your business needs. A fast-growing startup might need weekly deep dives. A stable enterprise might do fine with monthly check-ins.
Final Thoughts
Revenue analysis isn’t about being perfect with numbers. It’s about understanding your business well enough to make smart decisions.
You don’t need a finance degree. You don’t need to love spreadsheets. You just need to commit to regularly looking at your numbers, asking good questions, and acting on what you learn.
Start simple. Track your total revenue over time. Compare it to last month and last year. Look at which products or services generate the most money. Calculate your growth rate.
Then gradually add complexity as you get comfortable, segment analysis, customer metrics, forecasting.
The goal isn’t to become a financial analyst. The goal is to never again be in a position where you think you’re crushing it, only to discover you’re barely breaking even.
The best, fastest agentic notebook 2026? Livedocs.
- 8x speed response
- Ask agent to find datasets for you
- Set system rules for agent
- Collaborate
- And more
Get started with Livedocs and build your first live notebook in minutes.
- 💬 If you have questions or feedback, please email directly at a[at]livedocs[dot]com
- 📣 Take Livedocs for a spin over at livedocs.com/start. Livedocs has a great free plan, with $10 per month of LLM usage on every plan
- 🤝 Say hello to the team on X and LinkedIn
Stay tuned for the next tutorial!
Ready to analyze your data?
Upload your CSV, spreadsheet, or connect to a database. Get charts, metrics, and clear explanations in minutes.
No signup required — start analyzing instantly

