Self-Serve Product Analytics Without SQL Expertise
Every question product teams had, “How many users completed onboarding this week?” “What’s our retention looking like?” “Which feature is driving the most engagement?”, meant firing off a Slack message and waiting. Sometimes hours. Sometimes days. Once, memorably, three weeks because our data analyst was on vacation and nobody else could run the queries.
They were supposed to be making data-driven decisions while being completely cut off from the actual data.
You’re not alone. Research shows that at most companies, business users wait an average of 3-5 days for analytics requests. And here’s the fact: about 70% of those requests are for relatively simple questions that shouldn’t require a data scientist to answer.

That’s the problem self-serve analytics is supposed to solve. And when done right, it’s genuinely transformative. When done wrong? You’ve just created another tool that nobody uses and everyone resents.
Let me show you what actually works.
What Self-Serve Product Analytics Really Means
Self-serve analytics is exactly what it sounds like: the ability for non-technical team members to access, analyze, and act on data without constantly pinging the data team.
But it doesn’t mean everyone becomes a data analyst. It means removing the bottleneck between questions and answers.
Think of it this way: self-checkout at the grocery store doesn’t turn you into a cashier. It just gives you a faster path to buying your stuff when you only have a few items. You’re still not running the register for someone buying 200 items, and that’s fine. The goal isn’t to eliminate all support, it’s to handle the 80% of cases that are straightforward.
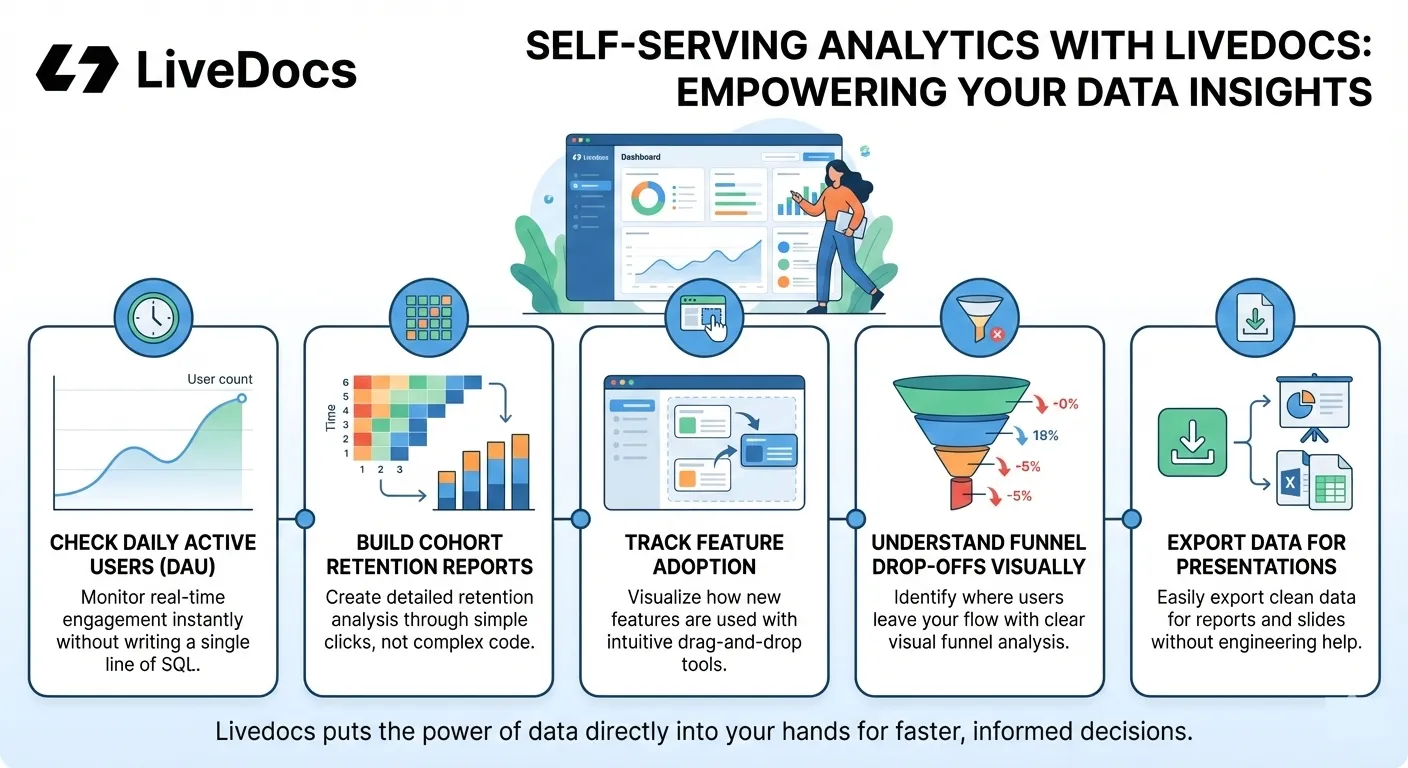
For product teams specifically, self-serve analytics means:
- Checking daily active users without writing SQL
- Building cohort retention reports through clicks, not code
- Tracking feature adoption with drag-and-drop interfaces
- Understanding funnel drop-offs visually
- Exporting data for presentations without engineering help
The promise is simple: faster insights, faster decisions, less waiting around. The reality? Well, that depends heavily on your setup.
The ability for non-technical team members to access, analyze, and act on data without constantly pinging the data team.
The SQL Problem
Let’s talk about SQL for a second.
SQL isn’t that hard to learn. Honestly, basic SQL queries are probably easier than Excel formulas. The real problems run deeper.
Problem #1: Context, not syntax
Even if you know SQL, do you know where the data lives? Which tables to join? What that cryptically-named field actually represents? Whether user_created_at is when the account was created or when the user record was added to the database?
One of our user, who is a product manager, spent an hour crafting the perfect SQL query, only to discover she’d been pulling data from the staging database instead of production. The numbers looked weird because half of them were test data.
Problem #2: Confidence and trust
Non-technical users face a massive confidence gap. Even when they write queries, they’re never quite sure the results are right. Is that retention number accurate, or did I mess up the join? Should I have filtered out internal users? Did I account for timezone differences?
This lack of confidence means people either avoid using the tools or (worse) second-guess every result, which defeats the entire purpose.
Problem #3: Iteration speed
Good product analysis isn’t about running one query, it’s about asking 15 follow-up questions as you explore the data. SQL makes that painfully slow. Write query, run it, check results, modify query, run again.
By the time you’ve figured out what’s actually happening, you’ve burned an hour and lost your train of thought three times.
Problem #4: It’s just not their job
Product managers, marketers, customer success folks, they didn’t sign up to become amateur database administrators. They need insights to do their actual jobs. Making them learn SQL is like requiring accountants to fix their own computers because “it’s not that hard.”
The point of self-serve analytics isn’t to teach everyone SQL. It’s to make SQL unnecessary.
What Makes Self-Serve Analytics Actually Work
We’ve tested probably two dozen analytics tools. Some promised the world and delivered chaos. Others couldn’t answer anything interesting.
The ones that actually work share a few critical characteristics:
1. Natural Language or Visual Interfaces
The best tools let you ask questions the way you’d ask a human. “Show me retention by cohort for the past three months” shouldn’t require translating that into a query language.
Visual query builders work too, drag-and-drop filters, point-and-click groupings. As long as the interface matches how people naturally think about their questions.
Tools like ThoughtSpot and newer AI-powered platforms have nailed this. You type a question, you get an answer. No syntax, no table names, no joins.
2. Pre-Modeled Metrics and Definitions
This is huge and often overlooked.
The best self-serve setups don’t just give you access to raw data, they give you access to metrics that have already been defined and validated by your data team. Things like “Monthly Active Users” or “Conversion Rate” or “Customer Lifetime Value.” These pre-built metrics solve two problems:
- Everyone uses the same definitions
- Non-technical users get reliable numbers without needing to understand the underlying calculations
Your data team defines “churn rate” once, properly. Then everyone else just selects “churn rate” from a menu. Perfect.
3. Contextual Data Governance
Self-serve doesn’t mean free-for-all. You need guardrails.
Good tools enforce what data people can access (PII restrictions, department-specific views) without making the experience feel locked down. Users should get the data they need without even seeing the data they don’t.
It’s like how modern cars have tons of safety features you never think about. They’re protecting you, but they’re not getting in your way.
4. Collaboration Features
Analytics isn’t a solo sport. You discover something interesting, you want to share it with your team.
The best platforms make it trivially easy to share dashboards, export reports, and collaborate on analysis. Even better when you can add comments, tag colleagues, or set up automated reports.
If sharing insights is harder than creating them, people won’t do it, and your org’s data knowledge stays siloed.
5. Speed and Performance
This seems obvious but you’d be surprised how many “self-serve” tools take 30 seconds to load a simple chart.
If the tool is slow, people abandon it. Full stop. Modern expectations are instant results. Anything longer than 2-3 seconds feels broken.
In-memory computing, optimized databases, smart caching, whatever the technical solution, the result needs to be fast.
The Real Barriers to Self-Serve Analytics
Most articles about self-serve analytics focus on the tools. But tools are maybe 40% of the solution. The other 60%? That’s organizational and cultural.
The Data Team Resistance
Data teams often resist self-serve initiatives, and honestly, their concerns are valid.
They’ve spent years building expertise. They know the data’s quirks, limitations, and edge cases. They’ve seen business users misinterpret data and make expensive mistakes.
Giving everyone access to data is not a good idea.
The solution isn’t to ignore these concerns, it’s to design self-serve systems that address them. Pre-validated metrics. Guardrails. Training. Clear documentation. And yes, a support path when people get stuck.
The data team’s role shifts from “answer every question” to “enable others to answer questions.” That’s a better use of their skills anyway.
The “I Don’t Know What I Don’t Know” Problem
Give someone access to a self-serve analytics tool and they often don’t know what to do with it. They log in, stare at a blank canvas, and feel overwhelmed. Where do they start? What questions should they ask? What’s even possible?
This is where templates, examples, and starter dashboards matter. Show people what good analysis looks like. Give them pre-built views for common questions. Create paths they can follow.
Think of it like YouTube recommendations. You might not know what you want to watch, but show you a curated list and suddenly you’re three hours deep in woodworking videos.
The Trust Deficit
I mentioned this earlier, but it’s worth repeating: non-technical users don’t trust their own analysis.
Even when they build a chart and the numbers look reasonable, there’s this nagging doubt. “Did I do this right? Should I double-check with the data team?”
Building trust takes time. It means:
- Clear documentation of what each metric means
- Transparent calculations users can review
- Validation from the data team that the tool’s outputs are reliable
- Success stories of other teams using self-serve effectively
Until people trust the tools, they won’t use them fully.
The Tool Graveyard
You know what most companies have? A dozen analytics tools that nobody uses.
Tableau licenses gathering dust. That Looker instance only the data team touches. Three different dashboarding solutions purchased by different departments.
Why? Because buying a tool is easy. Getting people to actually use it is hard.
Adoption requires training, champions, ongoing support, and honestly, a bit of force. “We’re using Tool X for product analytics. Here’s training. Here are resources. Let’s go.”
Without executive buy-in and clear expectations, self-serve tools join the graveyard.
Building Your Self-Serve Analytics Stack (A Practical Approach)
Alright, enough theory. Let’s talk about actually implementing this.
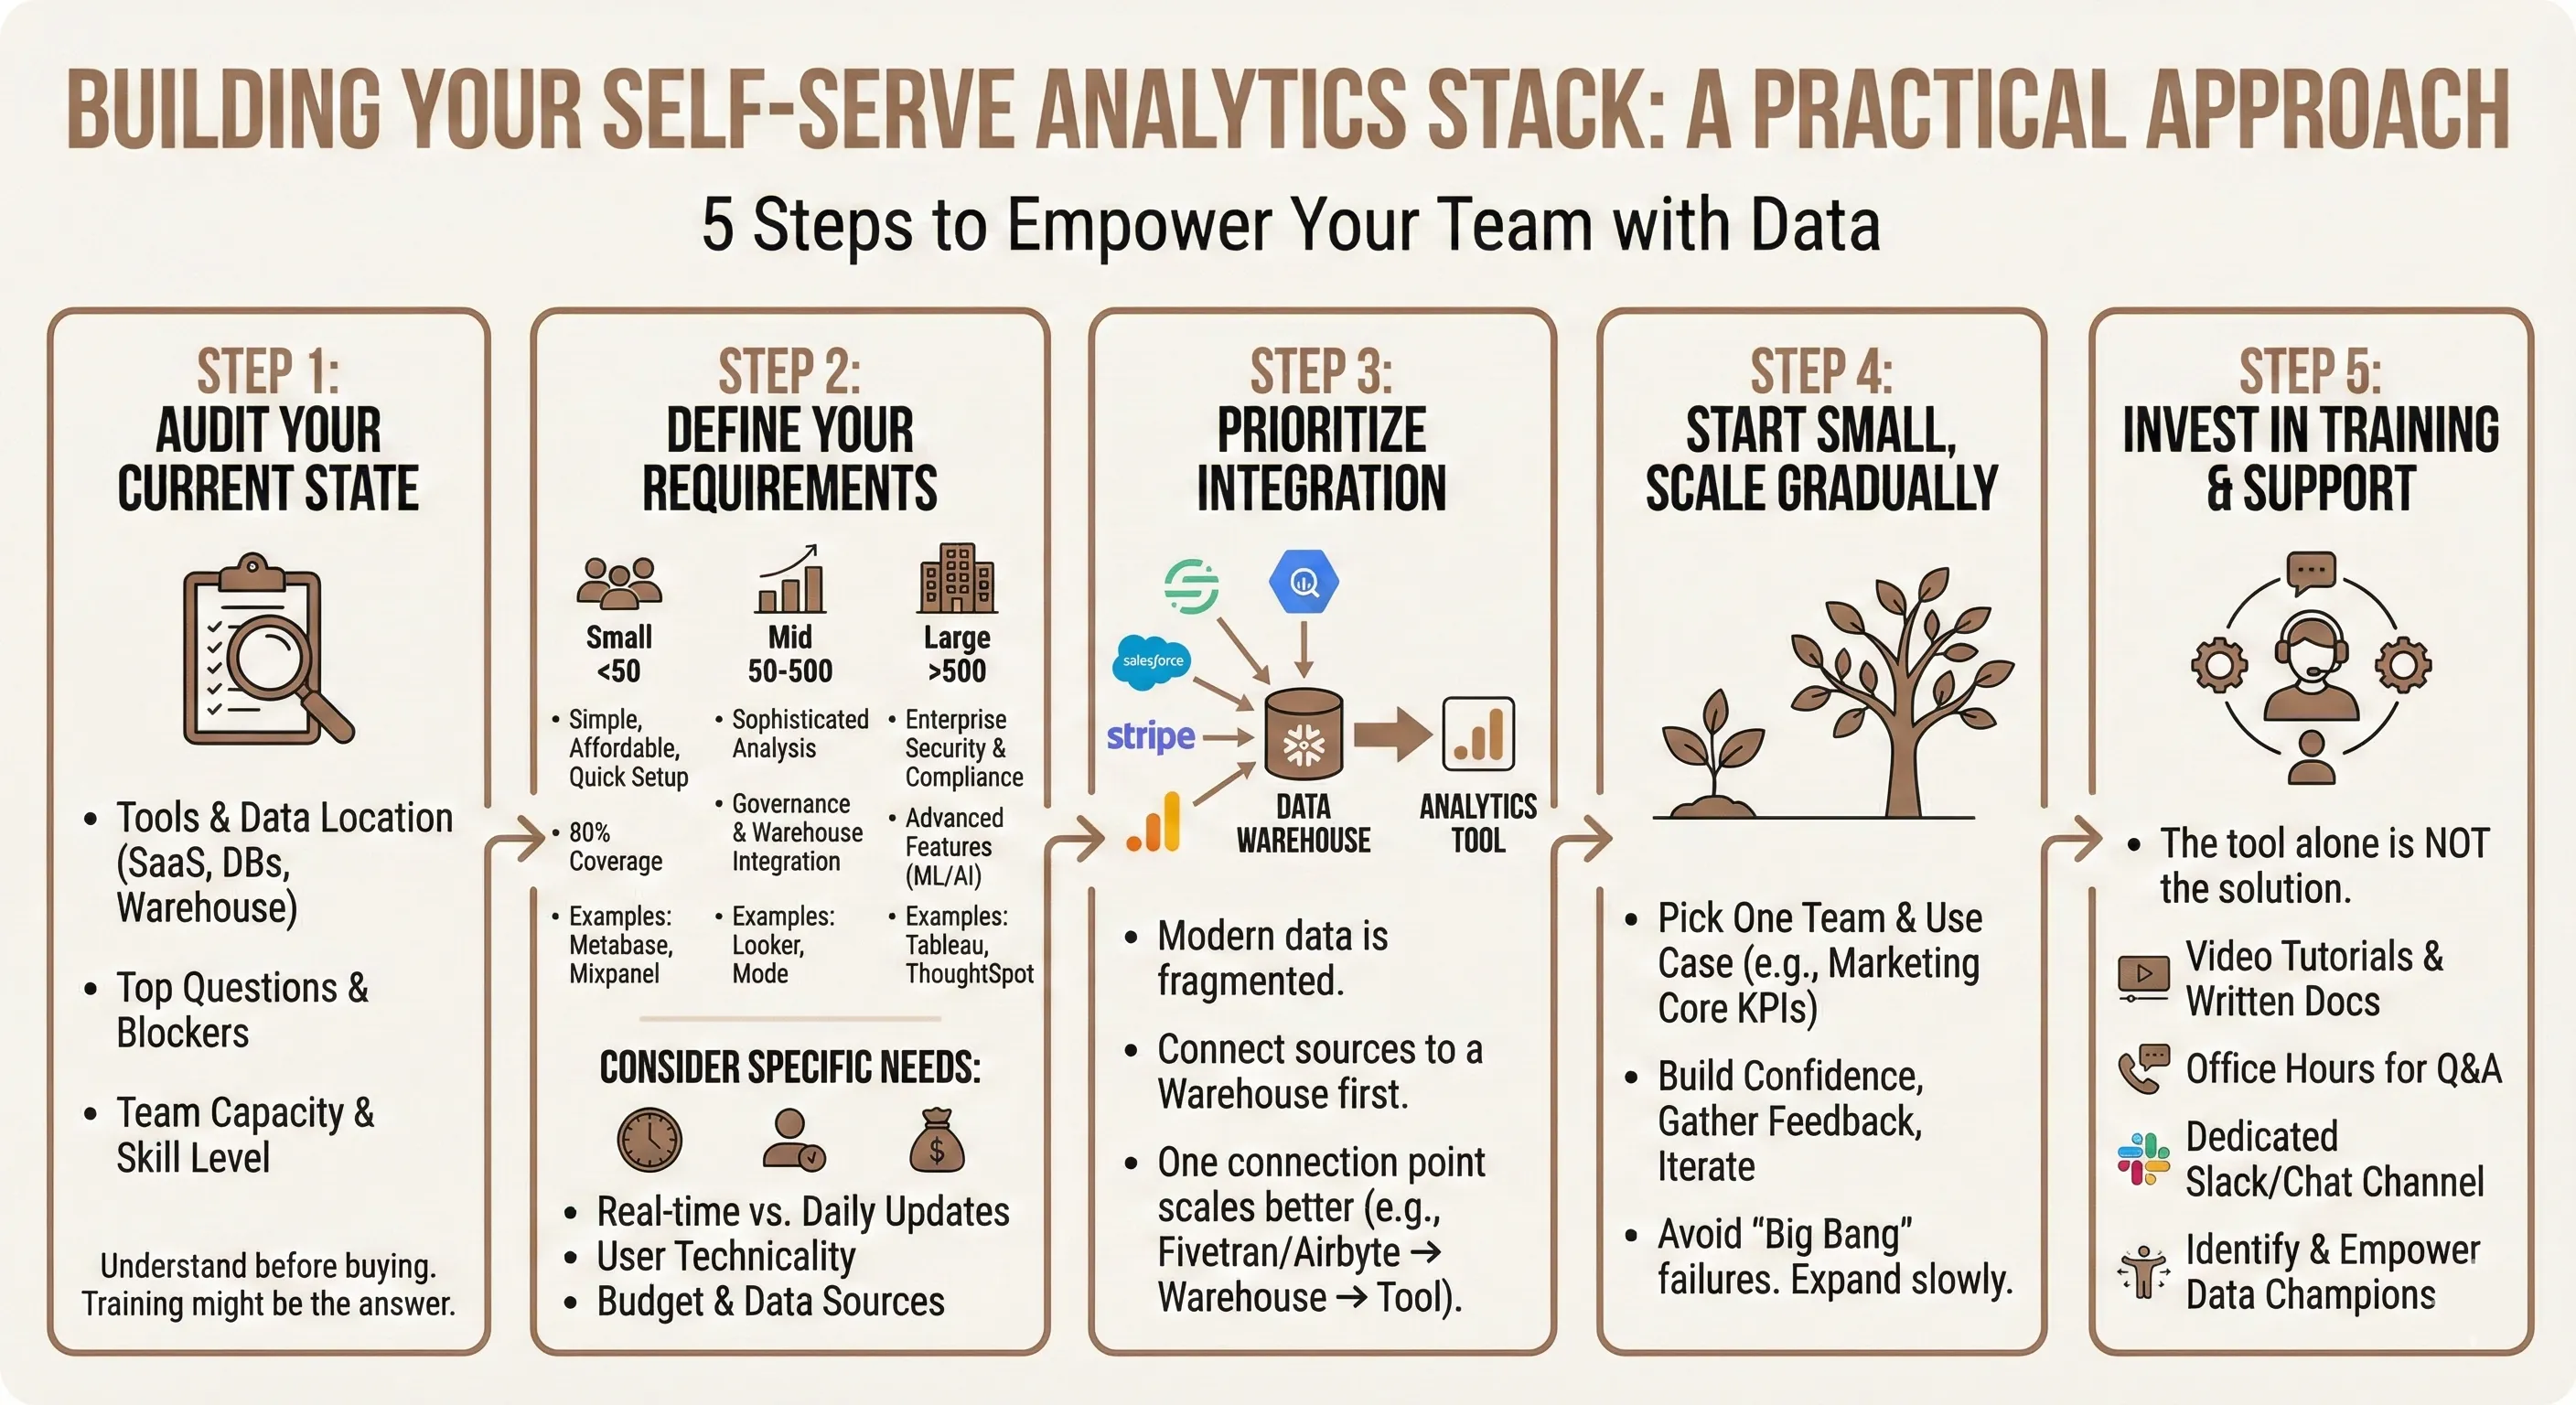
Step 1: Audit Your Current State
Before buying anything, understand what you’re working with:
- What tools do you currently use?
- Where does your data live? (Databases, SaaS tools, data warehouses)
- What questions do people ask most frequently?
- What’s blocking them from answering those questions themselves?
- What’s your data team’s capacity and skill level?
This audit reveals what you actually need. Maybe you don’t need a new tool, maybe you just need better training on existing ones.
Step 2: Define Your Requirements
Not every team needs the same thing. Consider:
For small teams (< 50 people):
- Simple, affordable tools
- Quick setup, minimal maintenance
- Covers 80% of common questions
- Examples: Metabase, Mixpanel (basic tier), Amplitude (starter)
For mid-size teams (50-500 people):
- More sophisticated analysis capabilities
- Better governance and access controls
- Integration with your data warehouse
- Examples: Looker, Mode, Holistics
For large enterprises (500+ people):
- Enterprise-grade security and compliance
- Advanced features (predictive analytics, ML)
- Extensive customization
- Examples: Tableau, ThoughtSpot, Qlik
But also consider your specific needs:
- Do you need real-time data or is daily updates fine?
- How technical is your average user?
- What data sources do you need to connect?
- What’s your budget?
Step 3: Prioritize Integration Over Features
The fanciest tool in the world is useless if it can’t access your data.
Modern data stacks are complicated. You might have:
- Customer data in Segment or Mixpanel
- Sales data in Salesforce
- Financial data in Stripe
- Product data in your own database
- Marketing data in Google Analytics
Your self-serve tool needs to either:
- Connect to all these sources directly, or
- Connect to your data warehouse where everything’s already unified
In my experience, the second approach scales better. Use tools like Fivetran or Airbyte to pipe data into Snowflake or BigQuery, then connect your analytics tool there. One connection point, all your data available.
Step 4: Start Small, Scale Gradually
Don’t try to make everything self-serve on day one. Pick one team (maybe product or marketing) and one set of use cases (maybe core KPIs and funnel analysis). Get that working really well. Build confidence, gather feedback, iterate. Then expand to other teams and use cases. This gradual rollout prevents the “we tried self-serve and it failed” scenario that kills these initiatives.
Step 5: Invest in Training and Support
I can’t stress this enough: the tool is not the solution. The tool plus training plus support is the solution. Create:
- Video tutorials for common tasks
- Written documentation with examples
- Office hours where people can ask questions
- A Slack channel for analytics help
- Champions in each team who become power users
Make it easy for people to get unstuck quickly, and they’ll actually use the tools.
How Livedocs Transforms Self-Serve Analytics for Product Teams
 Okay, let’s get practical about solving this problem with tools that actually work.
The challenge with most self-serve analytics platforms is they force you into one of two bad tradeoffs:
Okay, let’s get practical about solving this problem with tools that actually work.
The challenge with most self-serve analytics platforms is they force you into one of two bad tradeoffs:
- Too simple: Easy to use but can’t answer sophisticated questions
- Too complex: Powerful but requires technical expertise
Livedocs solves this by taking a fundamentally different approach. Instead of building another dashboard tool or trying to make SQL “easier,” it creates an AI-powered data workspace where you can analyze data using natural language while maintaining the depth technical users need.
Livedocs creates an AI-powered data workspace where you can analyze data using natural language while maintaining the depth technical users need.
Why Livedocs Works for Product Teams Without SQL Skills
Plain English questions, actual answers
You can literally ask “Show me retention by cohort for users who signed up in Q4” and get back a chart. No query builder, no dragging fields around. The AI understands what you’re asking and generates the analysis.
This isn’t some dumbed-down chatbot either, it’s connected to your actual data sources (CSVs, databases, data warehouses like Snowflake or BigQuery) and produces real, validated results.
Collaborative workspace, not isolated dashboards
Here’s what makes Livedocs different from traditional BI tools: it combines your data analysis with your strategic thinking in one place.
Instead of having your metrics in Tableau and your product strategy in Notion and your insights in Slack, everything lives together. You can build a document that shows current retention numbers (updating automatically), explains why they matter, outlines what you’re doing to improve them, and includes feedback from stakeholders, all in one collaborative workspace.
This is huge for product teams who need to share insights with context, not just numbers.
No SQL required, but SQL available
The AI handles the heavy lifting for most questions. But if you’re technical or want to customize something specific, you can write SQL or Python directly in the same workspace. It’s not either/or, it’s both.
This flexibility means everyone on your product team can contribute at their comfort level. Your PM can ask questions in English. Your analyst can write custom queries when needed. Both are working in the same tool, on the same data.
Real-time data without the infrastructure headache
Traditional self-serve setups require maintaining data pipelines, scheduling refreshes, managing caching layers. It’s infrastructure overhead that someone needs to handle.
Livedocs connects directly to your data sources and keeps everything updated automatically. Your metrics stay current without anyone manually refreshing dashboards or running jobs.
Templates and pre-built analyses
Don’t want to start from scratch? Livedocs lets your data team build templates for common analyses, cohort retention, funnel conversion, feature adoption, whatever your team needs most.
Then product managers can use these templates as starting points, customizing as needed. It’s the self-serve model that actually works: experts create the foundation, everyone else builds on it.
Real-World Workflows with Livedocs
Let me paint a picture of how this works in practice:
Product review:
Your VP asks, “How’s activation tracking for the new onboarding flow we shipped two weeks ago?” Instead of DMing your data analyst, you pull up Livedocs, ask “Show me activation rate for users who started onboarding after January 28th compared to the previous two weeks,” and get an instant chart. You share it in Slack with context about what it means.
Total time: 90 seconds.
Deep-dive analysis:
You notice retention dropping for a specific user segment. In Livedocs, you can explore: What features do they use? When do they drop off? How does their behavior differ from retained users? You’re asking follow-up questions and getting answers in real-time, building a comprehensive analysis without waiting on anyone.
Stakeholder presentations:
You need to present metrics to leadership. Instead of building a PowerPoint with static screenshots, you share a live Livedocs document. The numbers update automatically, stakeholders can explore different cuts of the data themselves, and all your strategic context is right there.
Cross-functional collaboration:
Marketing wants to know which acquisition channels drive the best user retention. Instead of running that analysis separately and emailing results, you create a shared Livedocs workspace where both teams can see the data, add their insights, and make decisions together.
This is self-serve analytics that actually serves the way product teams work, collaborative, iterative, context-rich, and fast.
Common Self-Serve Analytics Mistakes
I’ve seen enough self-serve implementations crash and burn to spot the patterns. Here are the killers:
Mistake #1: Treating It as Purely a Technology Problem
Buying a tool doesn’t create a self-serve culture. You need:
- Training and enablement
- Clear data governance policies
- Executive sponsorship
- Ongoing support
The tool is necessary but not sufficient.
Mistake #2: No Data Quality Controls
Self-serve only works if the underlying data is trustworthy. Bad data in, bad insights out, except now more people are making decisions based on bad insights.
Before going self-serve, clean up your data. Establish clear definitions. Document everything. Make sure your source systems are accurate.
Mistake #3: Overwhelming Users with Options
More features ≠ better. Ten ways to slice your data sounds great until users are paralyzed by choice. Start with the essentials. Add complexity gradually as people get comfortable.
Mistake #4: Not Measuring Adoption
You’ve spent money on tools. Are people using them? Track:
- Active users
- Most-used reports/dashboards
- Time-to-insight improvements
- Reduction in data team requests
If adoption is low, figure out why and fix it. Otherwise you’ve just bought expensive shelfware.
Mistake #5: Ignoring the Human Element
Some people will never love data analysis. That’s okay. Not everyone needs to be a power user.
Focus on making sure everyone can answer their most common questions. That’s the win. If 70% of your team can self-serve 80% of their analytics needs, you’ve succeeded.
The Future of Self-Serve: AI-Powered Analysis
Here’s where things get really interesting.
The next generation of self-serve analytics isn’t just about making SQL unnecessary, it’s about AI doing the analysis for you.
Imagine describing a business problem (“Our trial-to-paid conversion has been dropping”) and the AI:
- Pulls the relevant data automatically
- Identifies potential causes
- Generates hypotheses
- Suggests experiments to test them
- Creates visualizations explaining the issue
We’re not quite there yet, but we’re close. Tools like Livedocs are already using AI to bridge the gap between natural language questions and complex data analysis.
The promise is that self-serve analytics becomes less about “learning to use tools” and more about “asking good questions.” The AI handles the execution; you handle the strategy.
That’s the future I’m excited about, product teams focused on insights and decisions, not query syntax.
Final Thoughts
Self-serve product analytics isn’t about eliminating your data team. It’s not about everyone becoming an analyst. It’s not even primarily about cost savings.
It’s about speed and autonomy.
When product managers can answer their own questions, they iterate faster. When marketers can check campaign performance without waiting, they optimize in real-time. When customer success can segment users instantly, they personalize better. The bottleneck between question and answer disappears, and your whole team moves faster.
But getting there requires more than buying a tool. It requires:
- Choosing the right technology for your team’s actual skills and needs
- Building trust through training, governance, and support
- Starting small and scaling what works
- Measuring adoption and iterating based on feedback
Done right, self-serve analytics is genuinely transformative. Done wrong, it’s another abandoned tool in your tech stack. The difference? Focusing on the humans, not just the technology.
So if you’re still pinging your data team for basic metrics three days after you need them, it’s time to rethink your approach. Your questions deserve faster answers. Your decisions deserve better data. And your data team deserves to work on problems more interesting than “can you pull last week’s numbers again?”
Upload your datset to Livedocs now and get your insights fast.
- 8x speed response
- Ask agent to find datasets for you
- Set system rules for agent
- Collaborate
- And more
Get started with Livedocs and build your first live notebook in minutes.
- 💬 If you have questions or feedback, please email directly at a[at]livedocs[dot]com
- 📣 Take Livedocs for a spin over at livedocs.com/start. Livedocs has a great free plan, with $10 per month of LLM usage on every plan
- 🤝 Say hello to the team on X and LinkedIn
Stay tuned for the next tutorial!
Ready to analyze your data?
Upload your CSV, spreadsheet, or connect to a database. Get charts, metrics, and clear explanations in minutes.
No signup required — start analyzing instantly

