Student Performance & Learning Trends
The Need for Smarter Educational Insights
Education has always been about understanding how students learn, but in today’s world, learning happens across diverse backgrounds, technologies, and environments. With thousands of data points being generated from assessments, study habits, and student demographics, teachers and administrators face one big challenge: ”How to translate all that data into meaningful insights.”
That’s where Livedocs, the low-code AI notebook, brings a new dimension to educational analytics. Instead of requiring technical expertise in Python, SQL, or BI dashboards, educators and analysts can now use natural language commands to uncover trends, visualize student performance, and support personalized learning, all in a matter of minutes.
Understanding the Dataset
For this analysis, we used the “Students Performance in Exams” dataset from Kaggle, a simple yet powerful dataset that captures key academic indicators.
Dataset overview: Each record represents a student and includes features such as:
- Gender
- Race/Ethnicity
- Parental Level of Education
- Lunch Type (standard or free/reduced)
- Test Preparation Course (completed or not)
- Scores in Math, Reading, and Writing
This combination of demographic and academic data makes it ideal for exploring how background and preparation affect student success.
Why AI-Powered Analysis Matters in Education
Traditionally, analyzing educational data required spreadsheets or statistical coding tools, making it difficult for teachers and institutions to act quickly.
But with Livedocs, anyone, from a school principal to a researcher, can explore the data interactively using conversational prompts.
By enabling AI-powered insights, Livedocs helps:
- Identify learning gaps between student groups
- Understand how preparation impacts performance
- Personalize teaching strategies based on data
- Encourage data-driven academic interventions
A Step-by-Step Look: Using Livedocs for Students Data Visualization
Let’s explore how an analyst can turn a real Kaggle dataset, Students Performance in Exams — into actionable insights with Livedocs.
Upload and Prepare Your Data(Drag and drop / Upload a file):
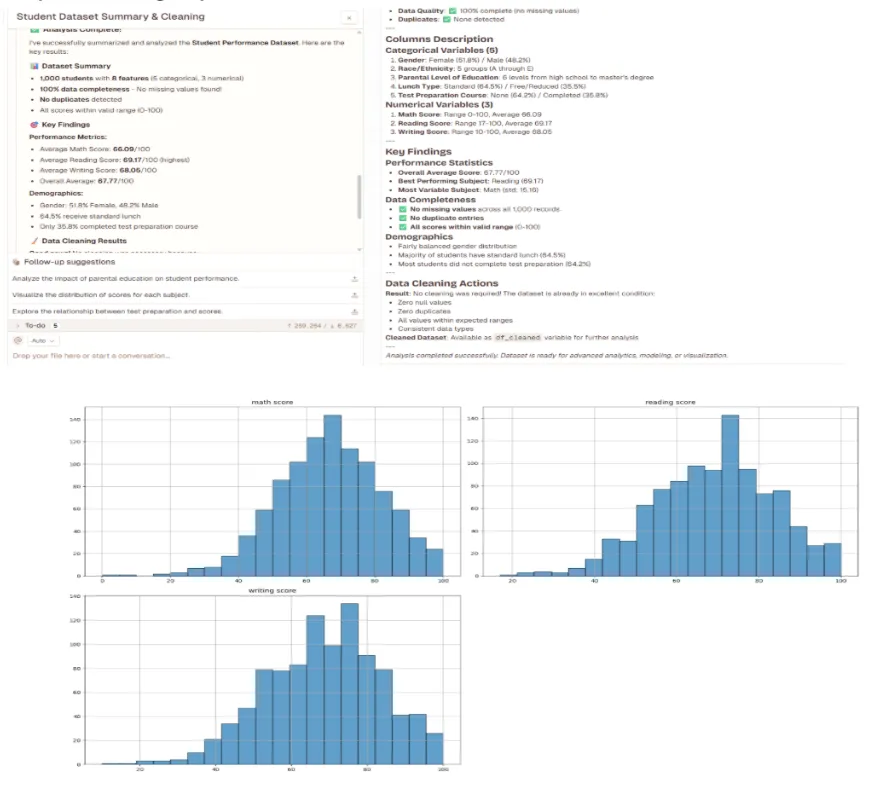
After uploading the dataset to Livedocs, the AI Agent automatically reads the data and provides an overview. You can start with a simple command: “Summarize this dataset and clean missing entries.”

Livedocs instantly summarizes each column, detects missing values, and displays descriptive statistics such as:
- Average, min, and max scores for Math, Reading, and Writing
- Distribution of genders and parental education levels
- Most common lunch type and preparation course status
This first output helps educators quickly understand the student population and data quality without needing to code.
Output: The AI Agent Provides:
Exploring Performance Patterns Using Natural Language
Now that the data is ready, you can begin exploring specific questions about student performance. For instance:
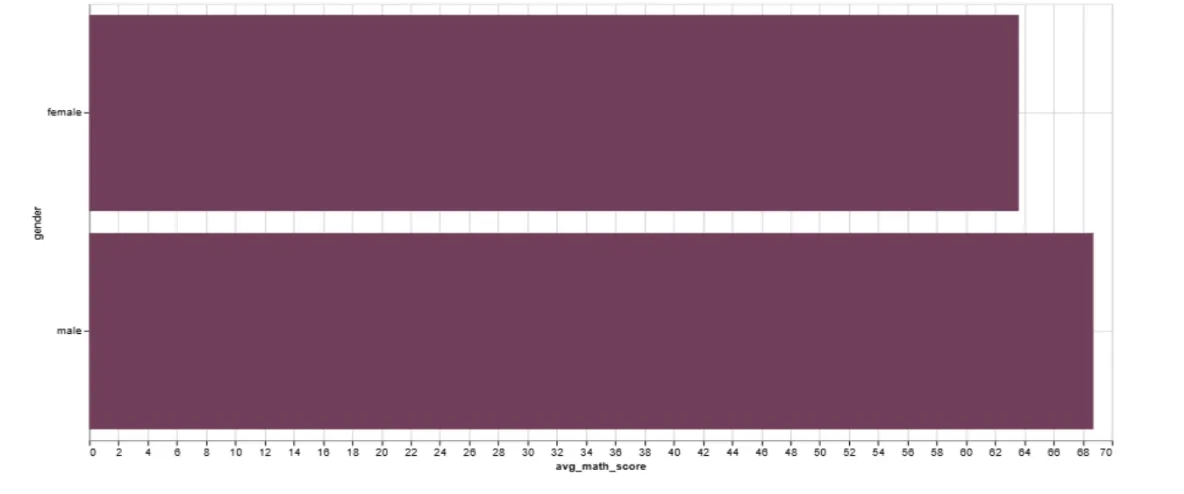
- “Show the average math score by gender.”
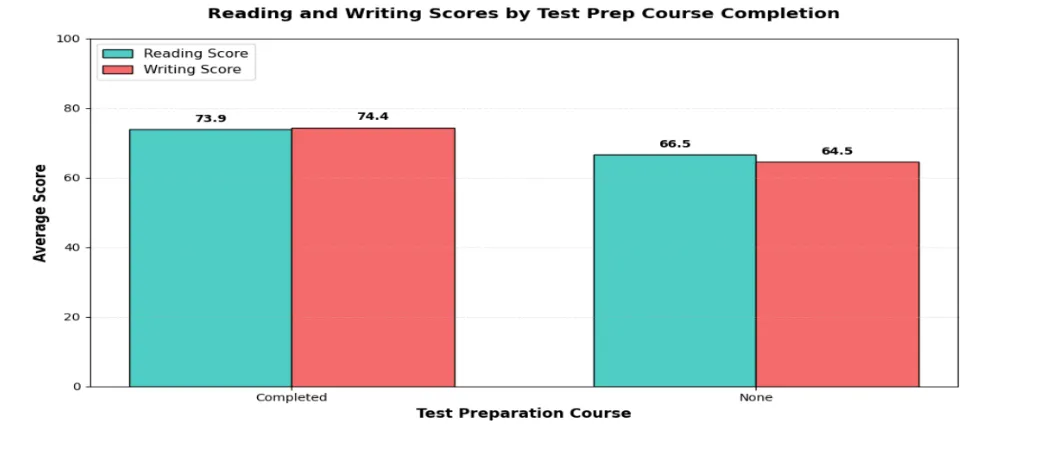
- “Compare reading and writing scores for students who completed the test prep course versus those who didn’t.”
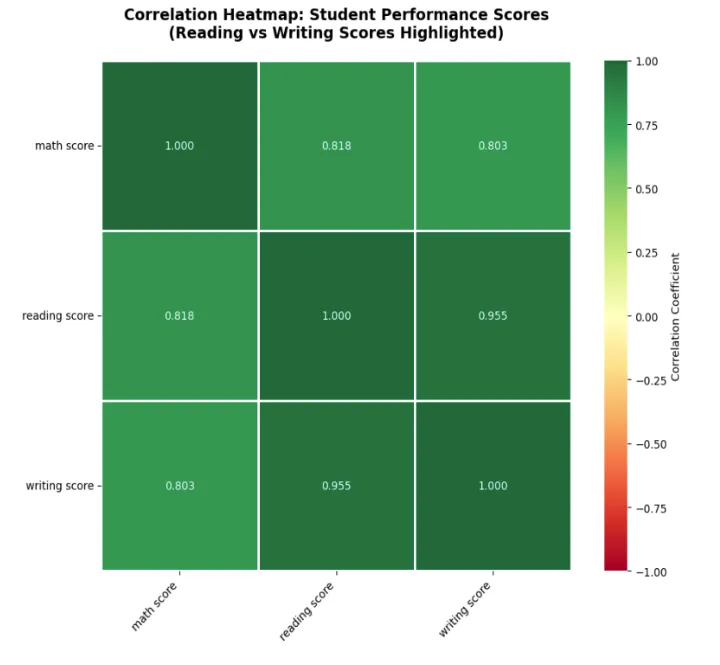
- “Find correlation between parental education level and average total score.”
Output Examples
A bar chart showing male vs. female average scores in each subject.
A line chart showing clear improvement among students who completed test preparation.
A correlation heatmap highlighting strong relationships between reading and writing scores.
These visualizations reveal not just patterns, but stories — like how test preparation directly impacts performance, or how parental education correlates with higher overall achievement.
Visualizing Learning Trends
Visualization is where insights truly come alive. With Livedocs, you can create visuals with simple prompts:
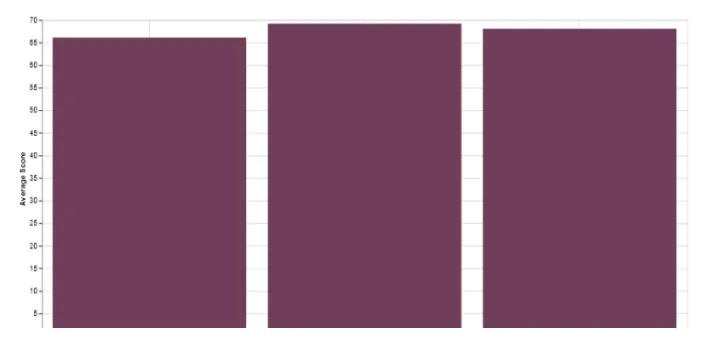
“Create a bar chart of average scores in math, reading, and writing.”
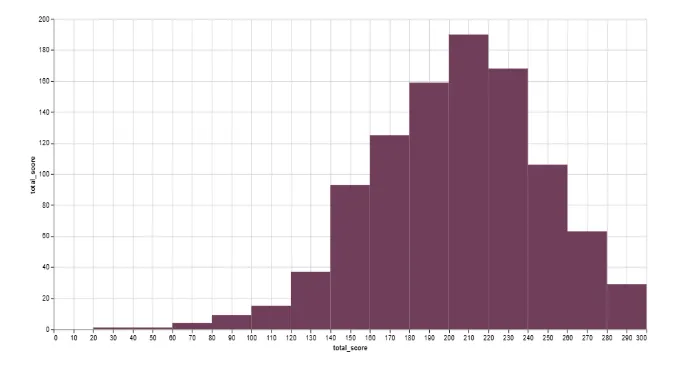
“Plot a histogram showing the distribution of total scores.”
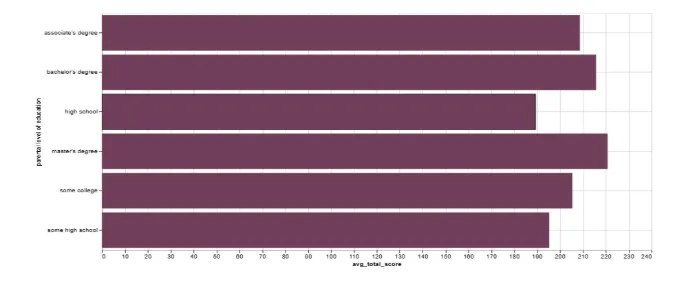
“Show average total score by parental education level.”
These outputs make it easy for teachers or administrators to identify which factors influence student success the most, whether it’s access to resources, preparation, or home environment.
Key Highlights
Top 5 Insights:
- Test Preparation is a Game-Changer ⭐
- Students who completed test prep scored 8-15% higher across all subjects
- Writing showed the biggest gain (+9.92 points, 15.4% improvement)
- Only 36% currently participate - huge opportunity for intervention
- Socioeconomic Gaps Are Substantial 💰
- Students with standard lunch outperform free/reduced lunch students by 7-11 points
- Math shows the largest gap (11.11 points)
- Affects 35.5% of the student population
- Parental Education Strongly Predicts Performance 🎓
- Almost perfect correlation (r=0.99) with student scores
- 31.51 point difference between highest (Master’s degree parents) and lowest (high school parents)
- Clear linear progression across all education levels
- Gender Patterns Vary by Subject 👥
- Males excel in Math (+5.10 points)
- Females excel in Reading (+7.14) and Writing (+9.16 points)
- Suggests need for targeted, subject-specific interventions
- Scores Are Highly Correlated 🔗
- Reading and Writing correlation: 0.955 (extremely strong)
- Students who struggle in one area typically struggle in others
- Points to need for comprehensive, holistic support programs
Data Quality:
✅ Perfect dataset - 1,000 complete records, zero missing values, no duplicates
The analysis includes visualizations and detailed statistical breakdowns throughout the notebook showing these patterns clearly. All insights are statistically significant and actionable for educational policy and intervention programs.
These outputs make it easy for teachers or administrators to identify which factors influence student success the most, whether it’s access to resources, preparation, or home environment.
Why Livedocs Makes Educational Data Exploration So Powerful
Livedocs transforms educational analytics by making it:
- Low-Code: No technical barriers; anyone can explore.
- Interactive: Natural language replaces queries.
- AI-Driven: Agents detect insights, correlations, and anomalies.
- Collaborative: Teams can share notebooks and findings instantly. It enables teachers, researchers, and policymakers to shift from manual data work to impact-driven insights that can shape better learning outcomes.
Translating Insights into Personalized Learning Strategies
The true value of data isn’t just in identifying trends, it’s in using those trends to improve learning outcomes. With the insights generated in Livedocs, educators can directly support students in more targeted and meaningful ways.
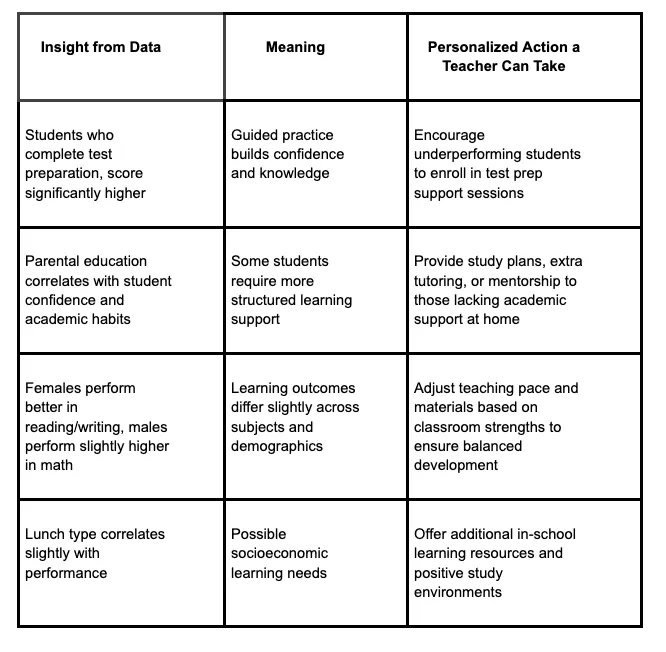
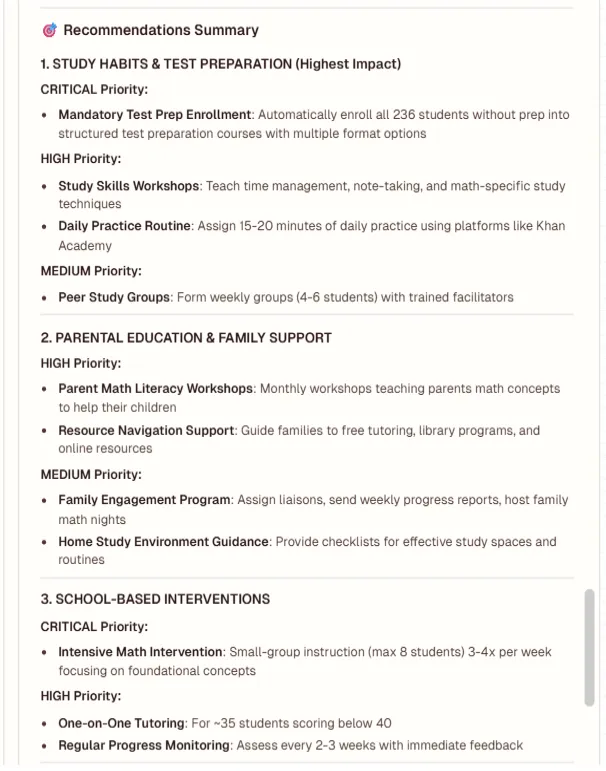
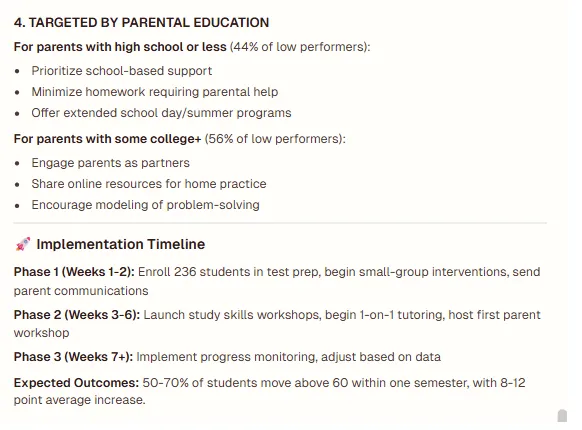
Example Prompt in Livedocs:“List recommendations to support students scoring below 60 in math based on study habits and parental education.
Output:
Conclusion
Personalizing Education Through Data
As education continues to evolve, data will play an even bigger role in shaping personalized learning paths.With tools like Livedocs, schools and educators can analyze student trends instantly, uncover what drives success, and tailor strategies to meet each learner’s needs.
AI-driven analytics is not about replacing teachers — it’s about empowering them with insights that lead to smarter, more inclusive education.
Key Takeaways
✅ Livedocs helps educators analyze academic trends without coding. ✅ The AI Agent reveals how factors like test prep and parental education affect performance. ✅ Interactive visualization makes it easy to personalize teaching based on data.
The best, fastest agentic notebook 2026? Livedocs.
- 8x speed response
- Ask agent to find datasets for you
- Set system rules for agent
- Collaborate
- And more
Get started with Livedocs and build your first live notebook in minutes.
- 💬 If you have questions or feedback, please email directly at a[at]livedocs[dot]com
- 📣 Take Livedocs for a spin over at livedocs.com/start. Livedocs has a great free plan, with $10 per month of LLM usage on every plan
- 🤝 Say hello to the team on X and LinkedIn
Stay tuned for the next tutorial!
Ready to analyze your data?
Upload your CSV, spreadsheet, or connect to a database. Get charts, metrics, and clear explanations in minutes.
No signup required — start analyzing instantly

