Visualizing Hospital & Patient Data
Hi, I am Atharva, and I’ve been using Livedocs to generate reports and works faster without manual editing. In this article, I’m excited to share my experience on visualising hospital and patient data, and hopefully help you get more out of your workflow.
The Hidden Power In Patient Data
Healthcare produces massive amounts of data every single day, from patient demographics, lab test results, and ICU durations to diagnostic images and discharge summaries. However, the real challenge lies not in collecting this data but in extracting meaningful insights from it.
Most healthcare professionals don’t have the time or coding expertise to analyze these large datasets using traditional tools like Python, SQL, or Power BI. The result? Valuable insights often remain buried in spreadsheets, waiting for data analysts to process them.
Livedocs, a low-code AI notebook, changes this dynamic completely. It empowers doctors, analysts, and hospital administrators to interact directly with their data using natural language.
With the help of the Livedocs AI Agent, even non-technical users can clean, explore, and visualize patient data in minutes, without a single line of code.
Why Visualization Matters in Healthcare
Data visualization in healthcare is far more than just pretty charts, it’s a critical step toward improving patient outcomes and operational efficiency.
When data is visualized effectively:
- Hospitals can detect spikes in admissions before resources run short.
- Clinicians can compare recovery trends across age groups or conditions.
- Administrators can track performance and outcomes in real time.
Traditional analytics tools demand technical effort and long turnaround times. Livedocs bridges that gap, combining AI-driven automation with an intuitive, low-code interface. Now, anyone in a healthcare team, not just data scientists, can visualize data stories that inform faster and smarter decisions.
Livedocs: Low-Code AI for Smarter Data Exploration
Livedocs combines the flexibility of a notebook interface with the intelligence of an AI Agent that understands natural language. Instead of coding with Pandas or SQL, users simply describe what they want:
“Clean this hospital dataset and show a bar chart of patient admissions by condition.”
Within moments, the AI Agent preprocesses the data, handles missing values, and visualizes insights directly in the notebook. The Livedocs Agent automatically:
- Identifies and handles missing values.
- Normalizes inconsistent data (like “M/F” vs. “Male/Female”).
- Generates clean visuals that summarize the results instantly.
It’s data exploration reimagined, intuitive, conversational, and completely code-free.
A Step-by-Step Look: Using Livedocs for Patient Data Visualization
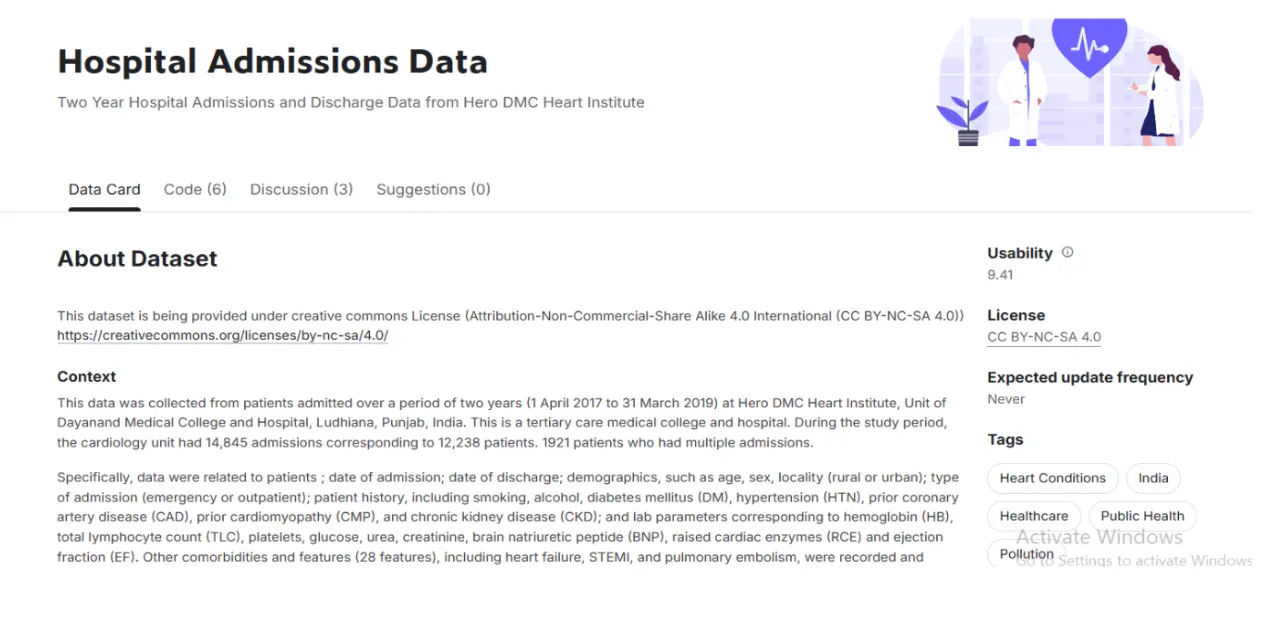
Let’s explore how a healthcare analyst can turn a real Kaggle dataset, the Hospital Admissions Dataset, into actionable insights with Livedocs.
This dataset includes over 40 parameters, such as:
- Demographics: Age, Gender, Rural/Urban background.
- Medical history: Diabetes (DM), Hypertension (HTN), CAD, CKD.
- Clinical details: Duration of stay, ICU days, lab readings (Glucose, Urea, Creatinine, BNP).
- Outcomes: Recovery, mortality, or critical events.
Let’s see how a healthcare analyst could use Livedocs to turn a complex hospital dataset into actionable insights.
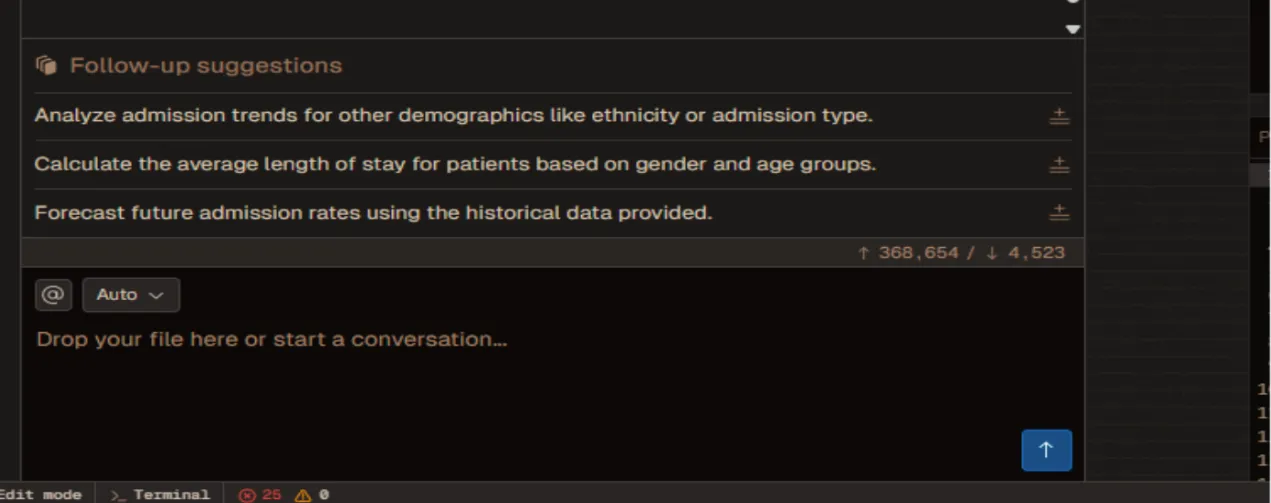
File Upload
Upload and prepare your data (drag and drop/upload a file)
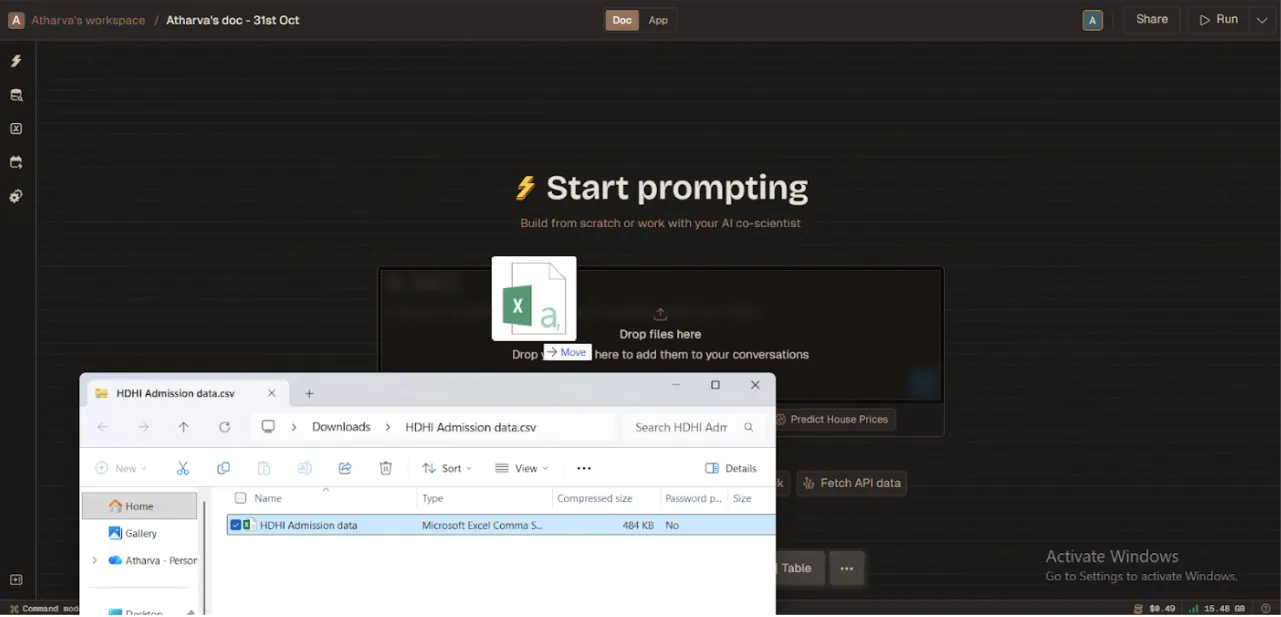
Then simply ask:
“Summarize this dataset and clean any missing or invalid entries.”
Livedocs automatically detects inconsistencies, fills missing data where possible, and generates an instant overview — no manual cleaning required.
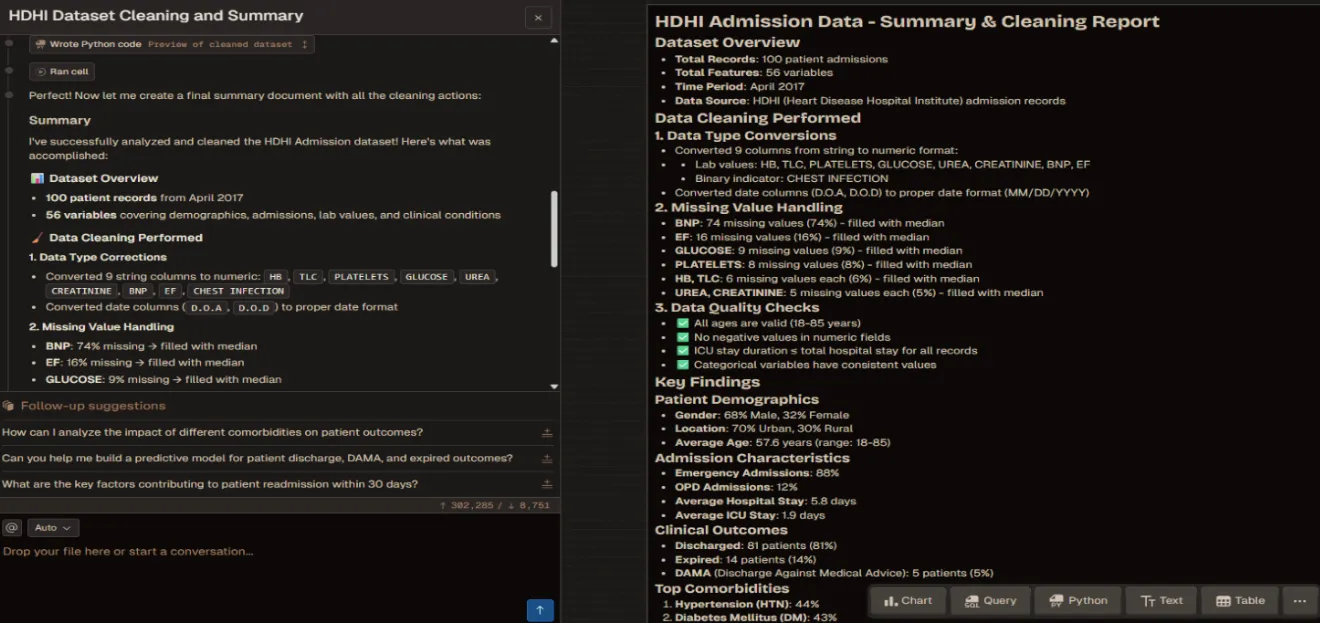
- A summary of key numerical and categorical variables.
- Detection of missing or inconsistent entries.
- Automatic data cleaning and normalization.
The resulting output includes descriptive statistics like average age, gender ratios, and hospital stay duration — giving a clear first glance at patient demographics.
Explore with Natural Language
Once the dataset is clean, you can begin exploration through conversation.
- “Show average hospital stay by condition.”
- “Compare mortality rate between patients with and without diabetes.”
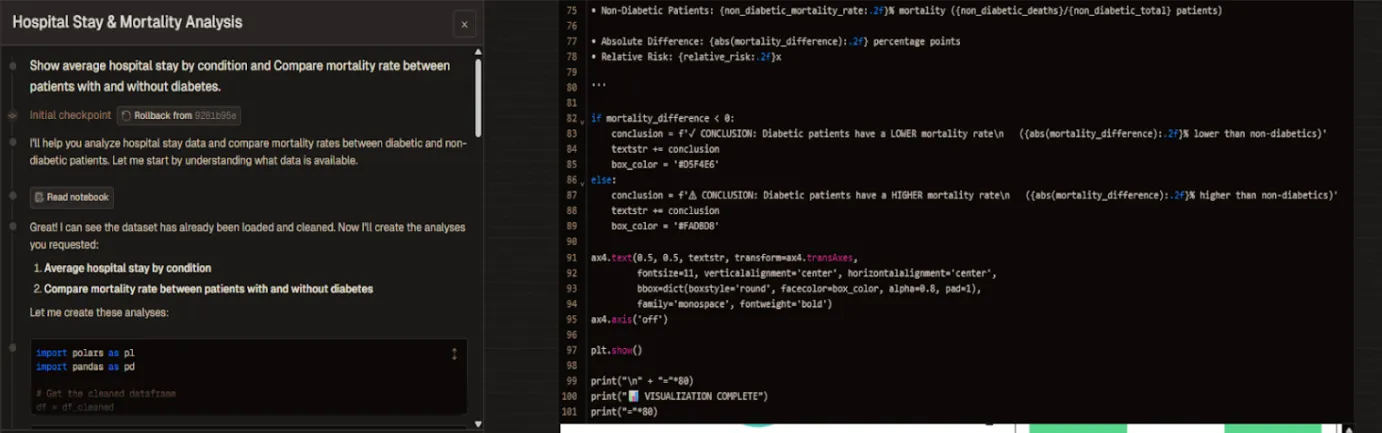
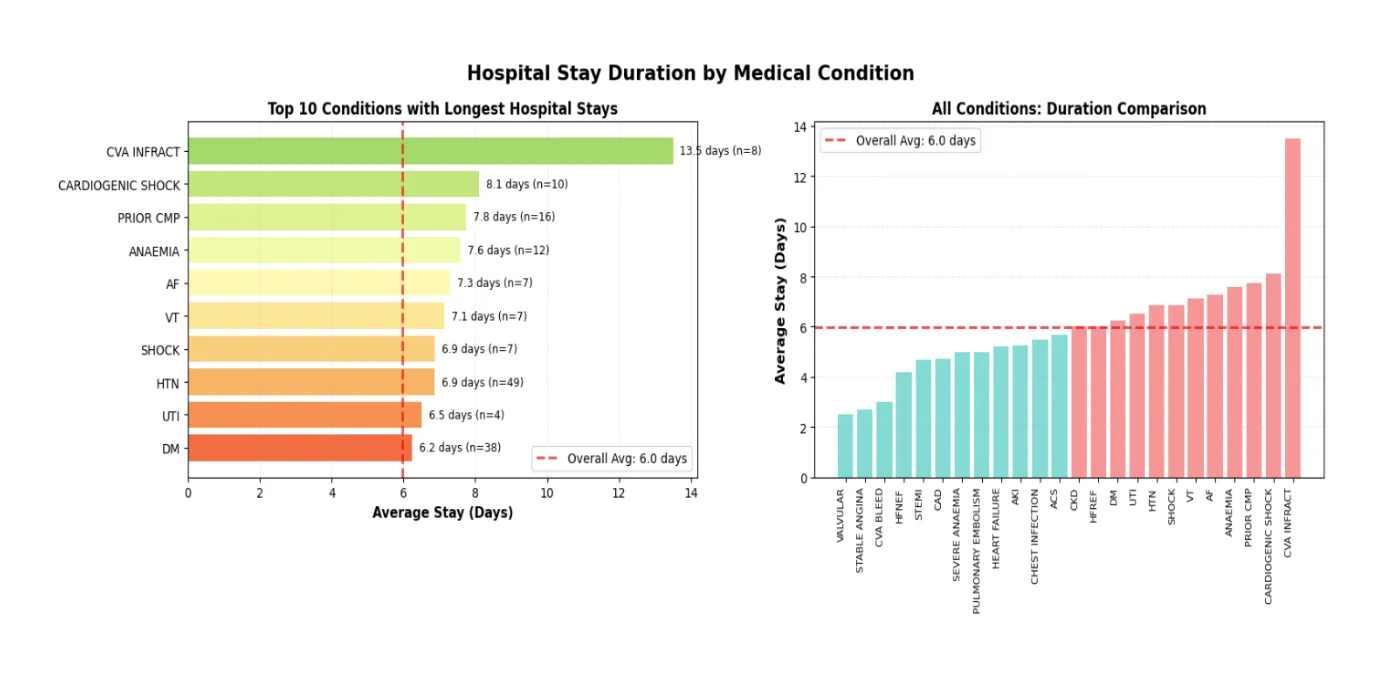
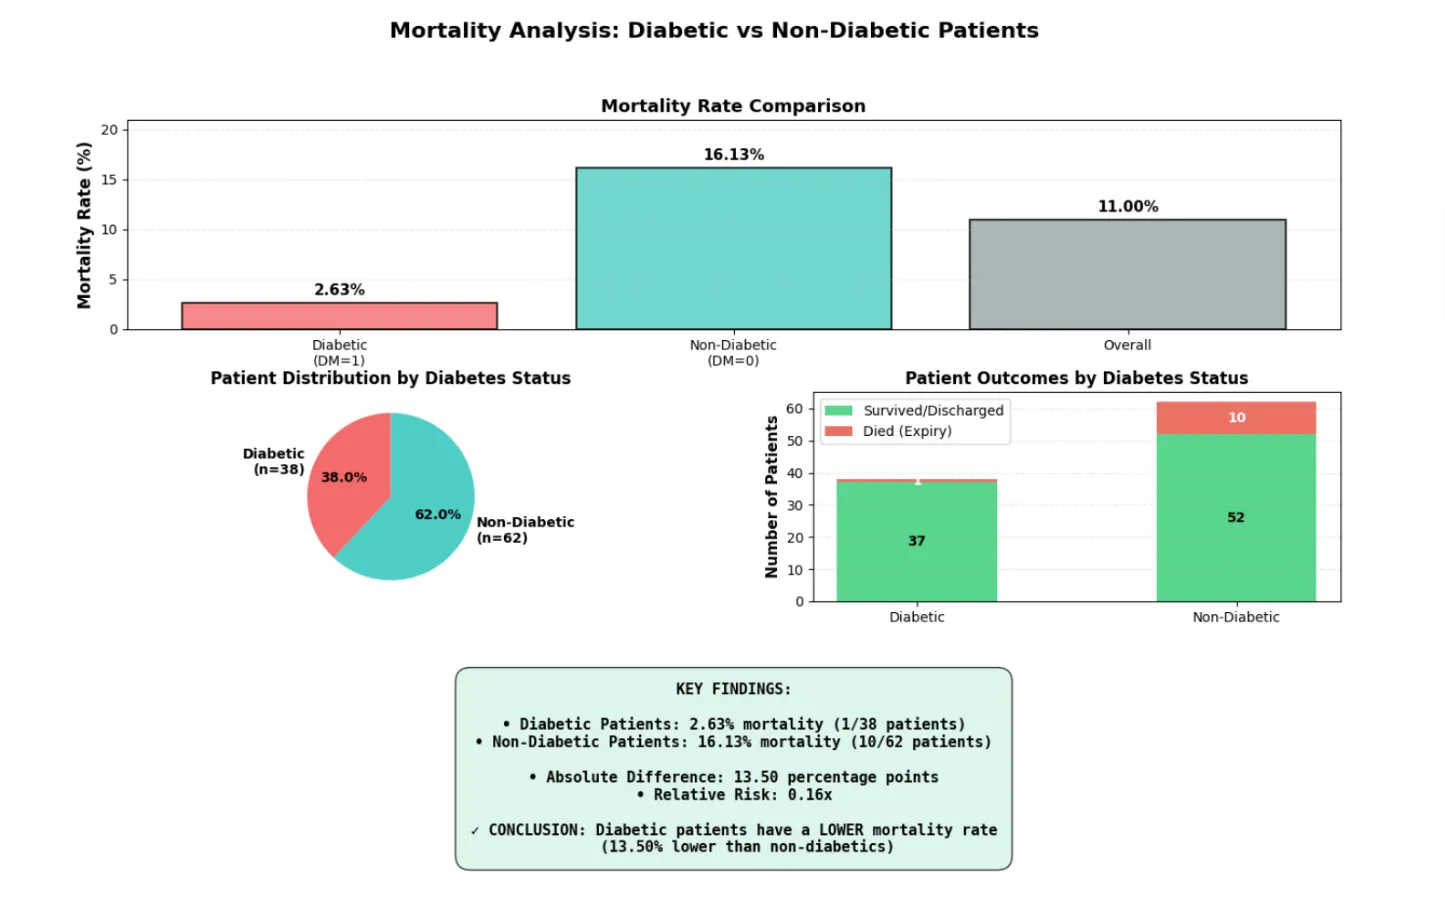
Livedocs quickly computes and visualizes the answers. In the graph below, we can clearly see how patients with chronic conditions like diabetes or hypertension tend to have longer hospital stays, providing critical insights for both clinical and administrative teams.
Beyond computation, the Agent also explains how it derived each insight, making it easy to interpret results even for non-technical readers.
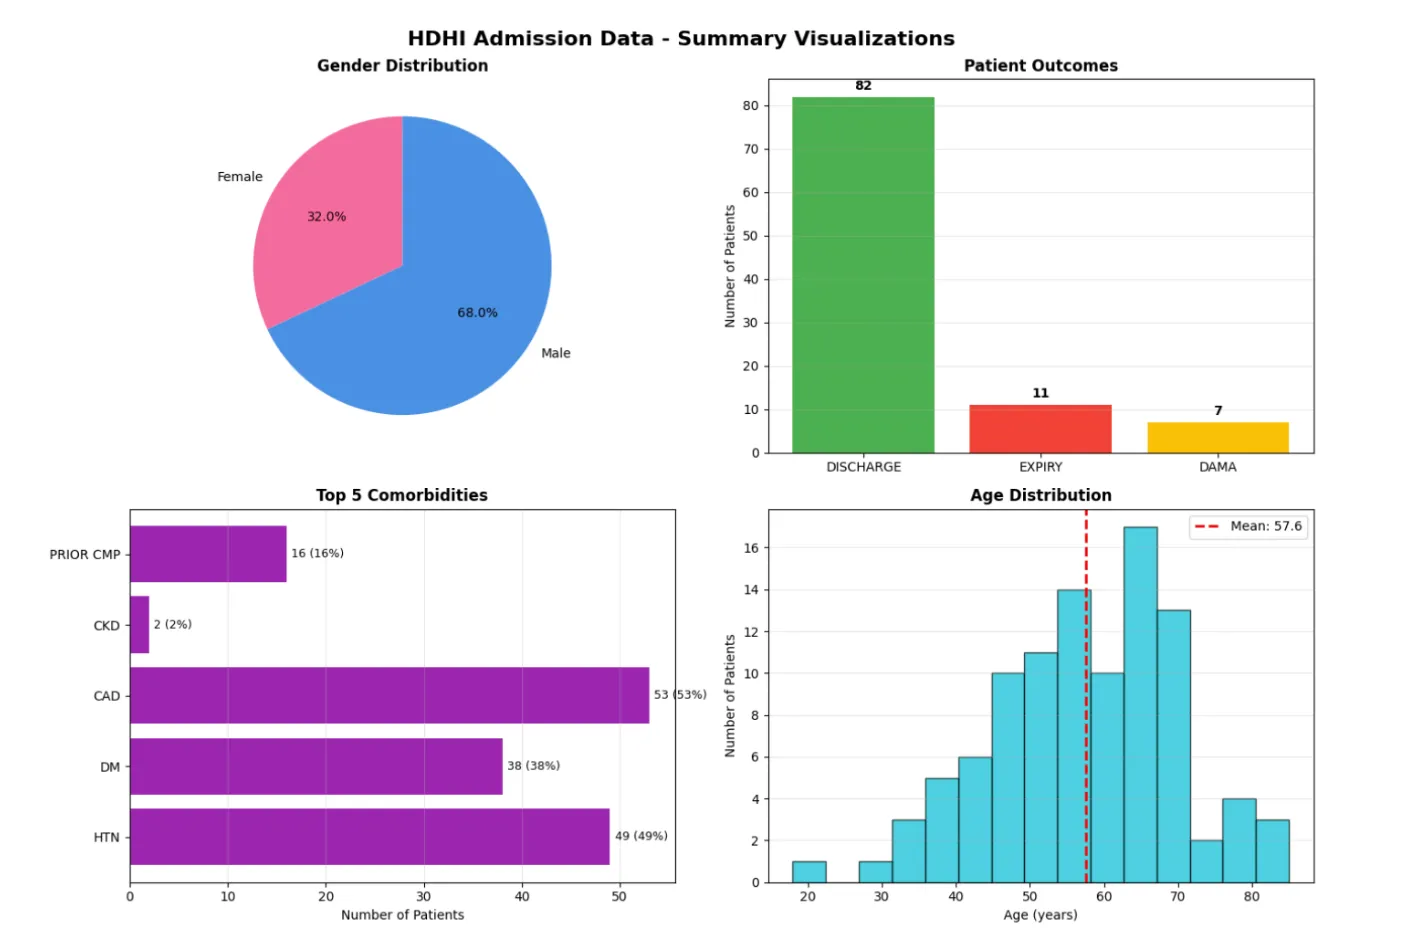
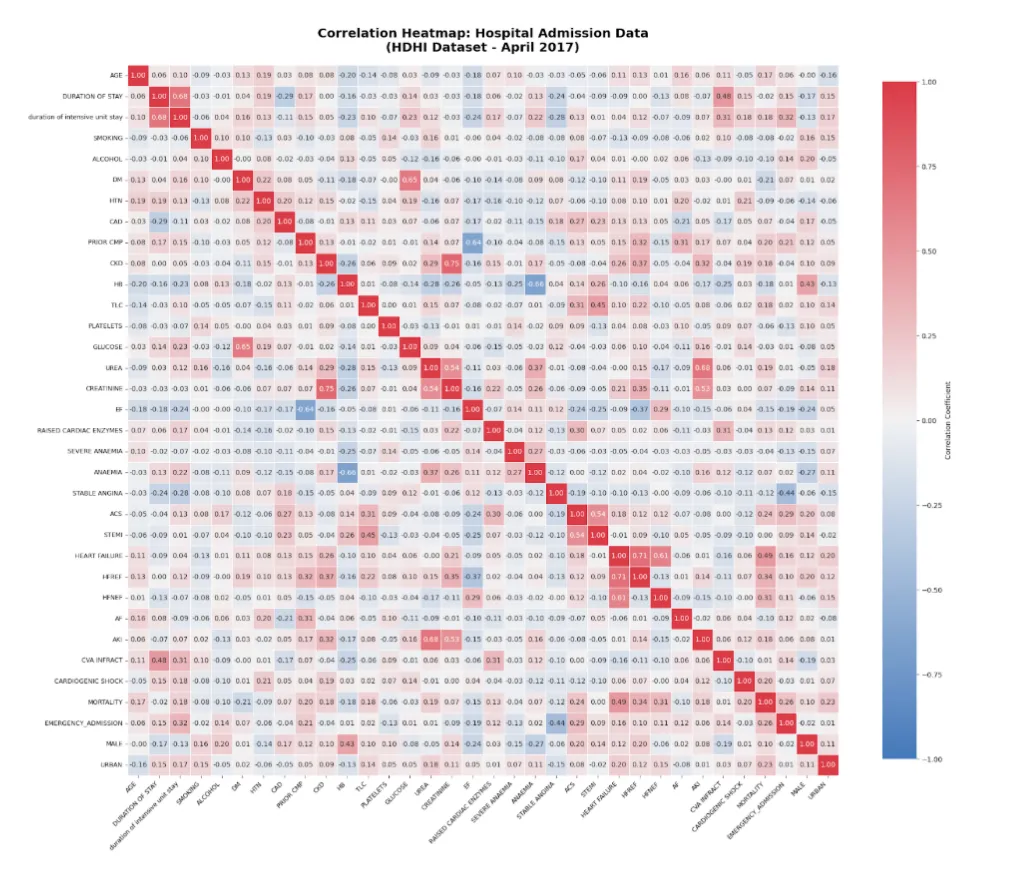
Generate Visual Insights Instantly
Visualization is just as simple. You can create clean, interactive visuals by asking:
- “Plot a histogram of patient age distribution.”
- “Show a line chart of admissions over time by gender.”
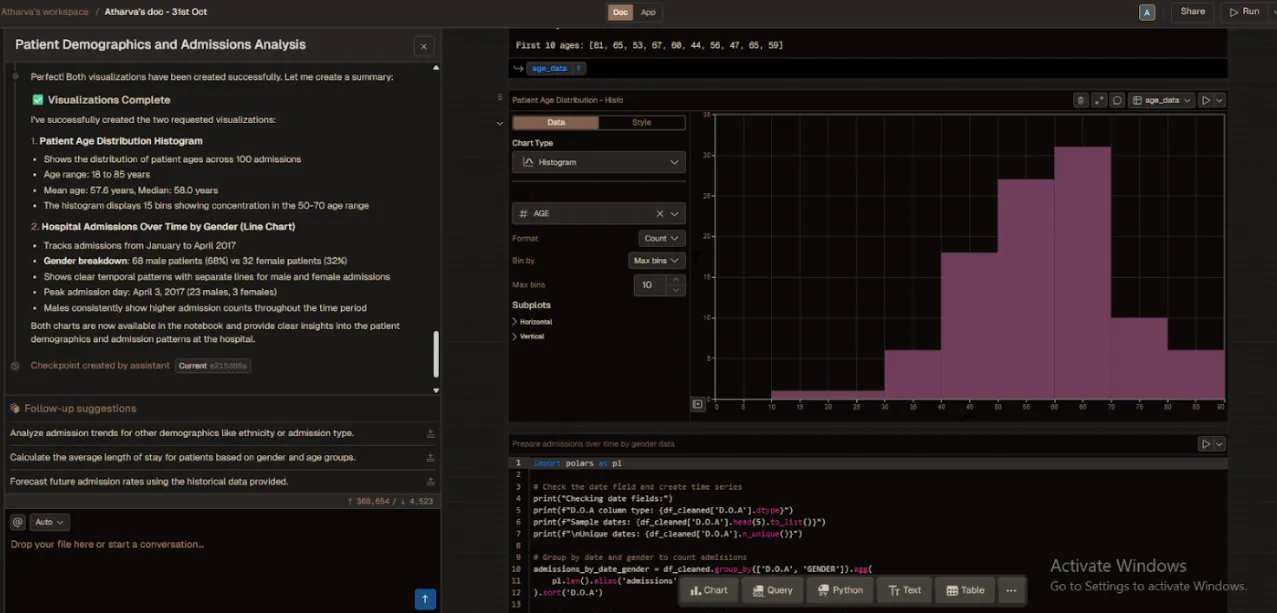
Livedocs handles chart generation automatically, making it ideal for presentations, dashboards, or quick analytics reviews.
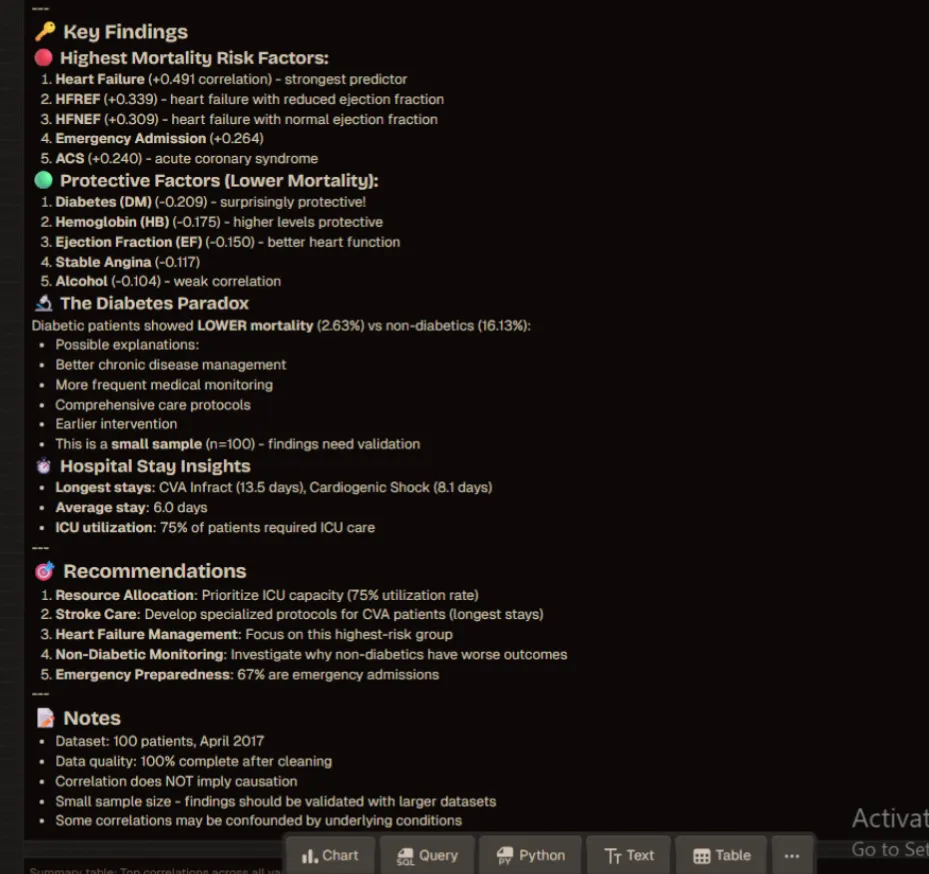
Insights That Drive Better Outcomes
Livedocs allows teams to extract insights in minutes, such as:
- Departments with the highest readmission rates
- Seasonal trends in patient admissions
- Impact of comorbidities (like DM or HTN) on outcomes
- ICU stay durations by age group
All without switching between tools or writing queries.The Livedocs Agent also suggests next steps, for example:
“Would you like to visualize recovery rates by gender?”, Livedocs guiding users deeper into analysis seamlessly.
The Future of Healthcare Analytics Is Low-Code and AI-Driven
Healthcare analytics is moving toward accessibility, where AI and domain knowledge work hand in hand.
Low-code tools like Livedocss are leading this evolution, empowering medical professionals to act on insights directly instead of waiting for reports.
By combining AI automation with notebook simplicity, Livedocs transforms raw data into actionable visual stories, enabling data-driven healthcare decisions at every level.
In an industry where every dataset represents human lives, tools like Livedocs are not just simplifying analysis, they’re empowering professionals to visualize and improve patient outcomes faster than ever before
The best, fastest agentic notebook 2026? Livedocs.
- 8x speed response
- Ask agent to find datasets for you
- Set system rules for agent
- Collaborate
- And more
Get started with Livedocs and build your first live notebook in minutes.
- 💬 If you have questions or feedback, please email directly at a[at]livedocs[dot]com
- 📣 Take Livedocs for a spin over at livedocs.com/start. Livedocs has a great free plan, with $10 per month of LLM usage on every plan
- 🤝 Say hello to the team on X and LinkedIn
Stay tuned for the next tutorial!
Ready to analyze your data?
Upload your CSV, spreadsheet, or connect to a database. Get charts, metrics, and clear explanations in minutes.
No signup required — start analyzing instantly

