Which Stocks To Buy 2026?
Everyone’s got a stock tip for you.
Your friend swears by some crypto-adjacent penny stock. Your financial advisor mumbles something about diversified index funds. Meanwhile, Wall Street’s loudest voices are shouting contradictory advice through their Bloomberg terminals.
But what if we stripped away the noise and just looked at the numbers? That’s exactly what we did using Livedocs, a platform that combines Python’s analytical muscle with SQL’s data-wrangling capabilities, all wrapped up in an interactive notebook that actually makes sense of this market chaos.
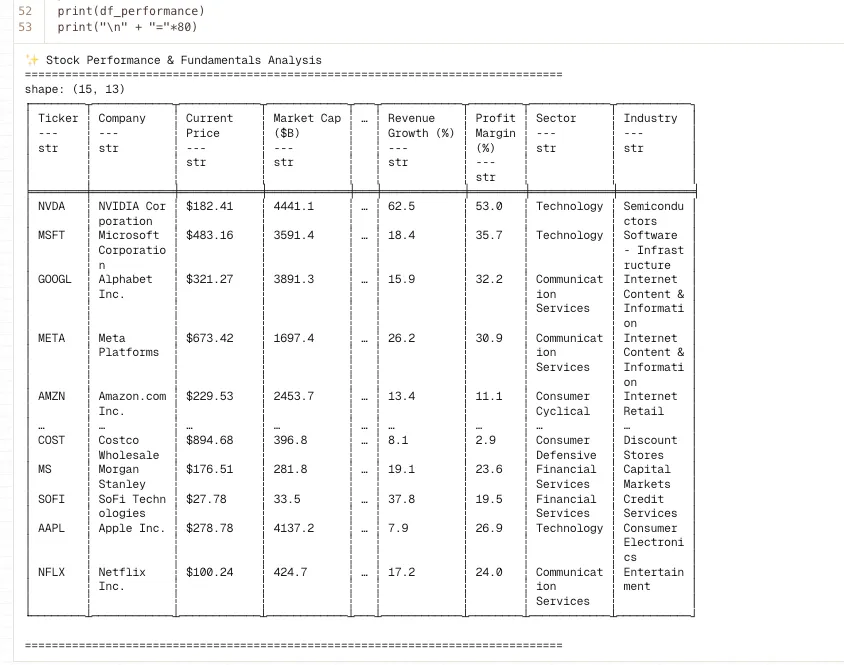
We analyzed 15 carefully selected stocks across five key sectors, crunched three years of historical data, examined fundamentals, calculated risk-adjusted returns, and built a comprehensive investment scoring model. The result? A clear picture of where the smart money might be heading in 2026.
You can read the notebook here: use this link
The Heavy Hitters Everyone’s Watching
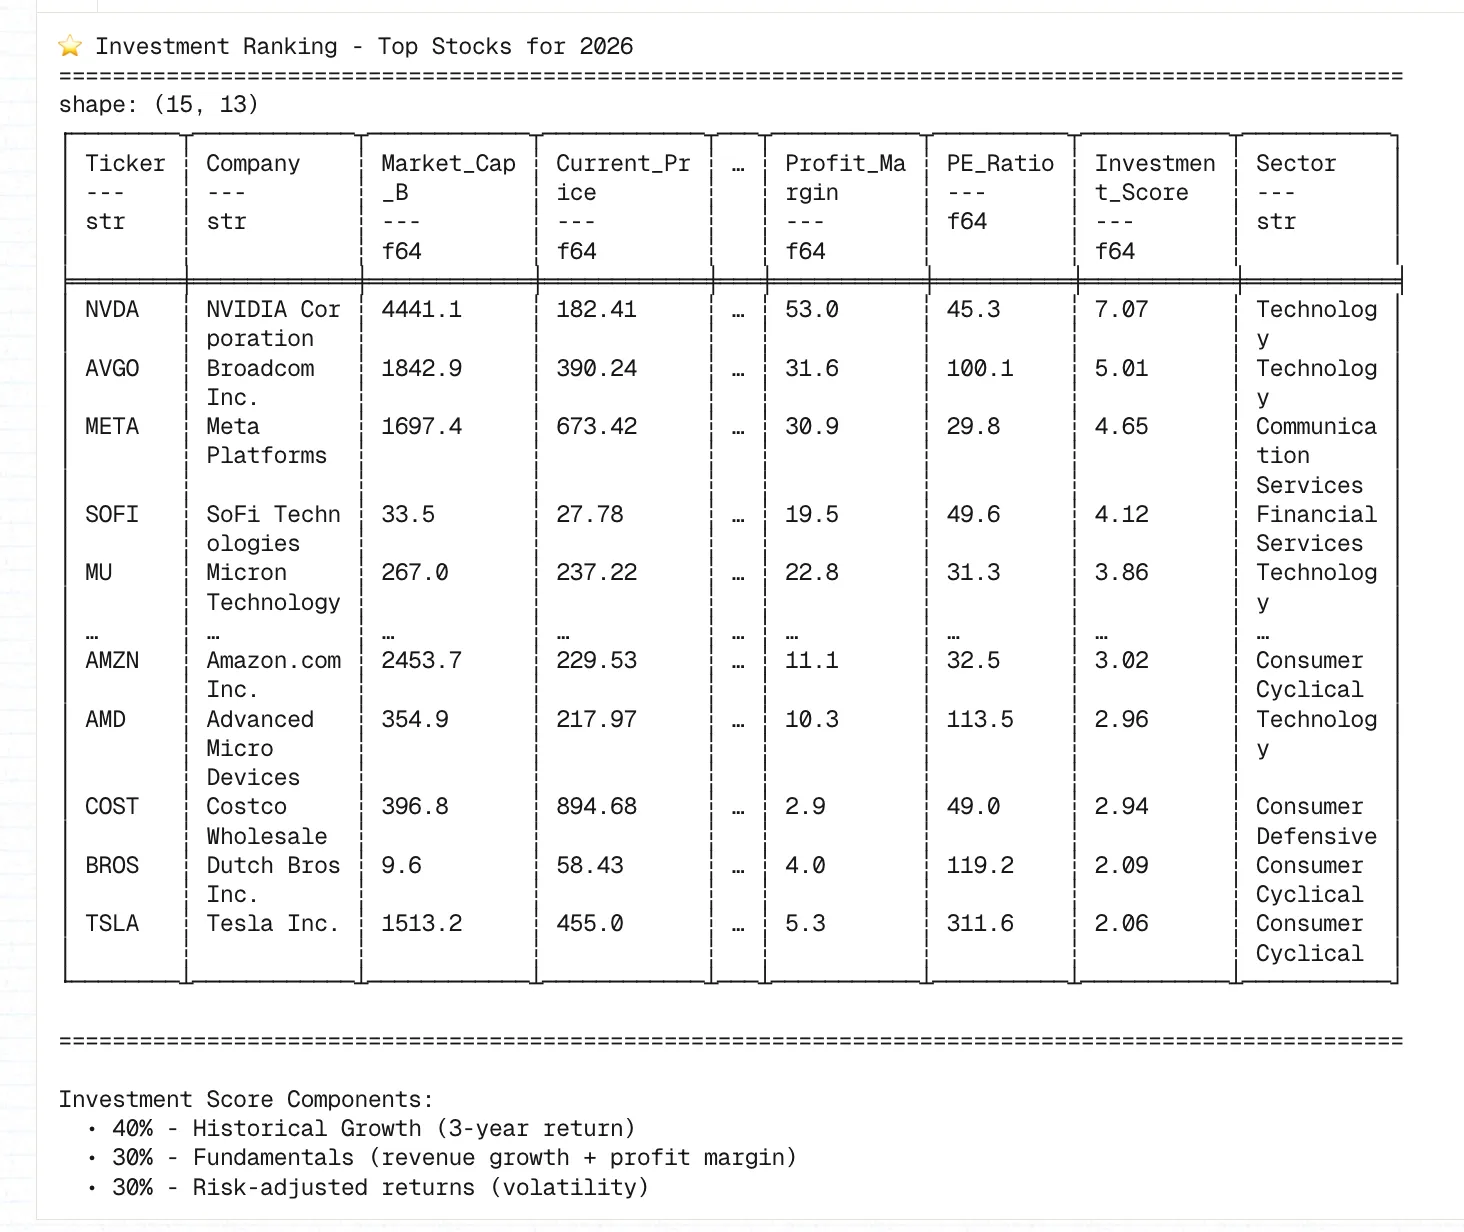
Let’s start with the obvious: NVIDIA. If you’ve been following tech stocks at all, and honestly, who hasn’t? You know NVIDIA’s been on an absolutely bonkers run. We’re talking a 963.5% three-year return. Not 96.3%. Not a typo. Nine hundred and sixty-three point five percent.
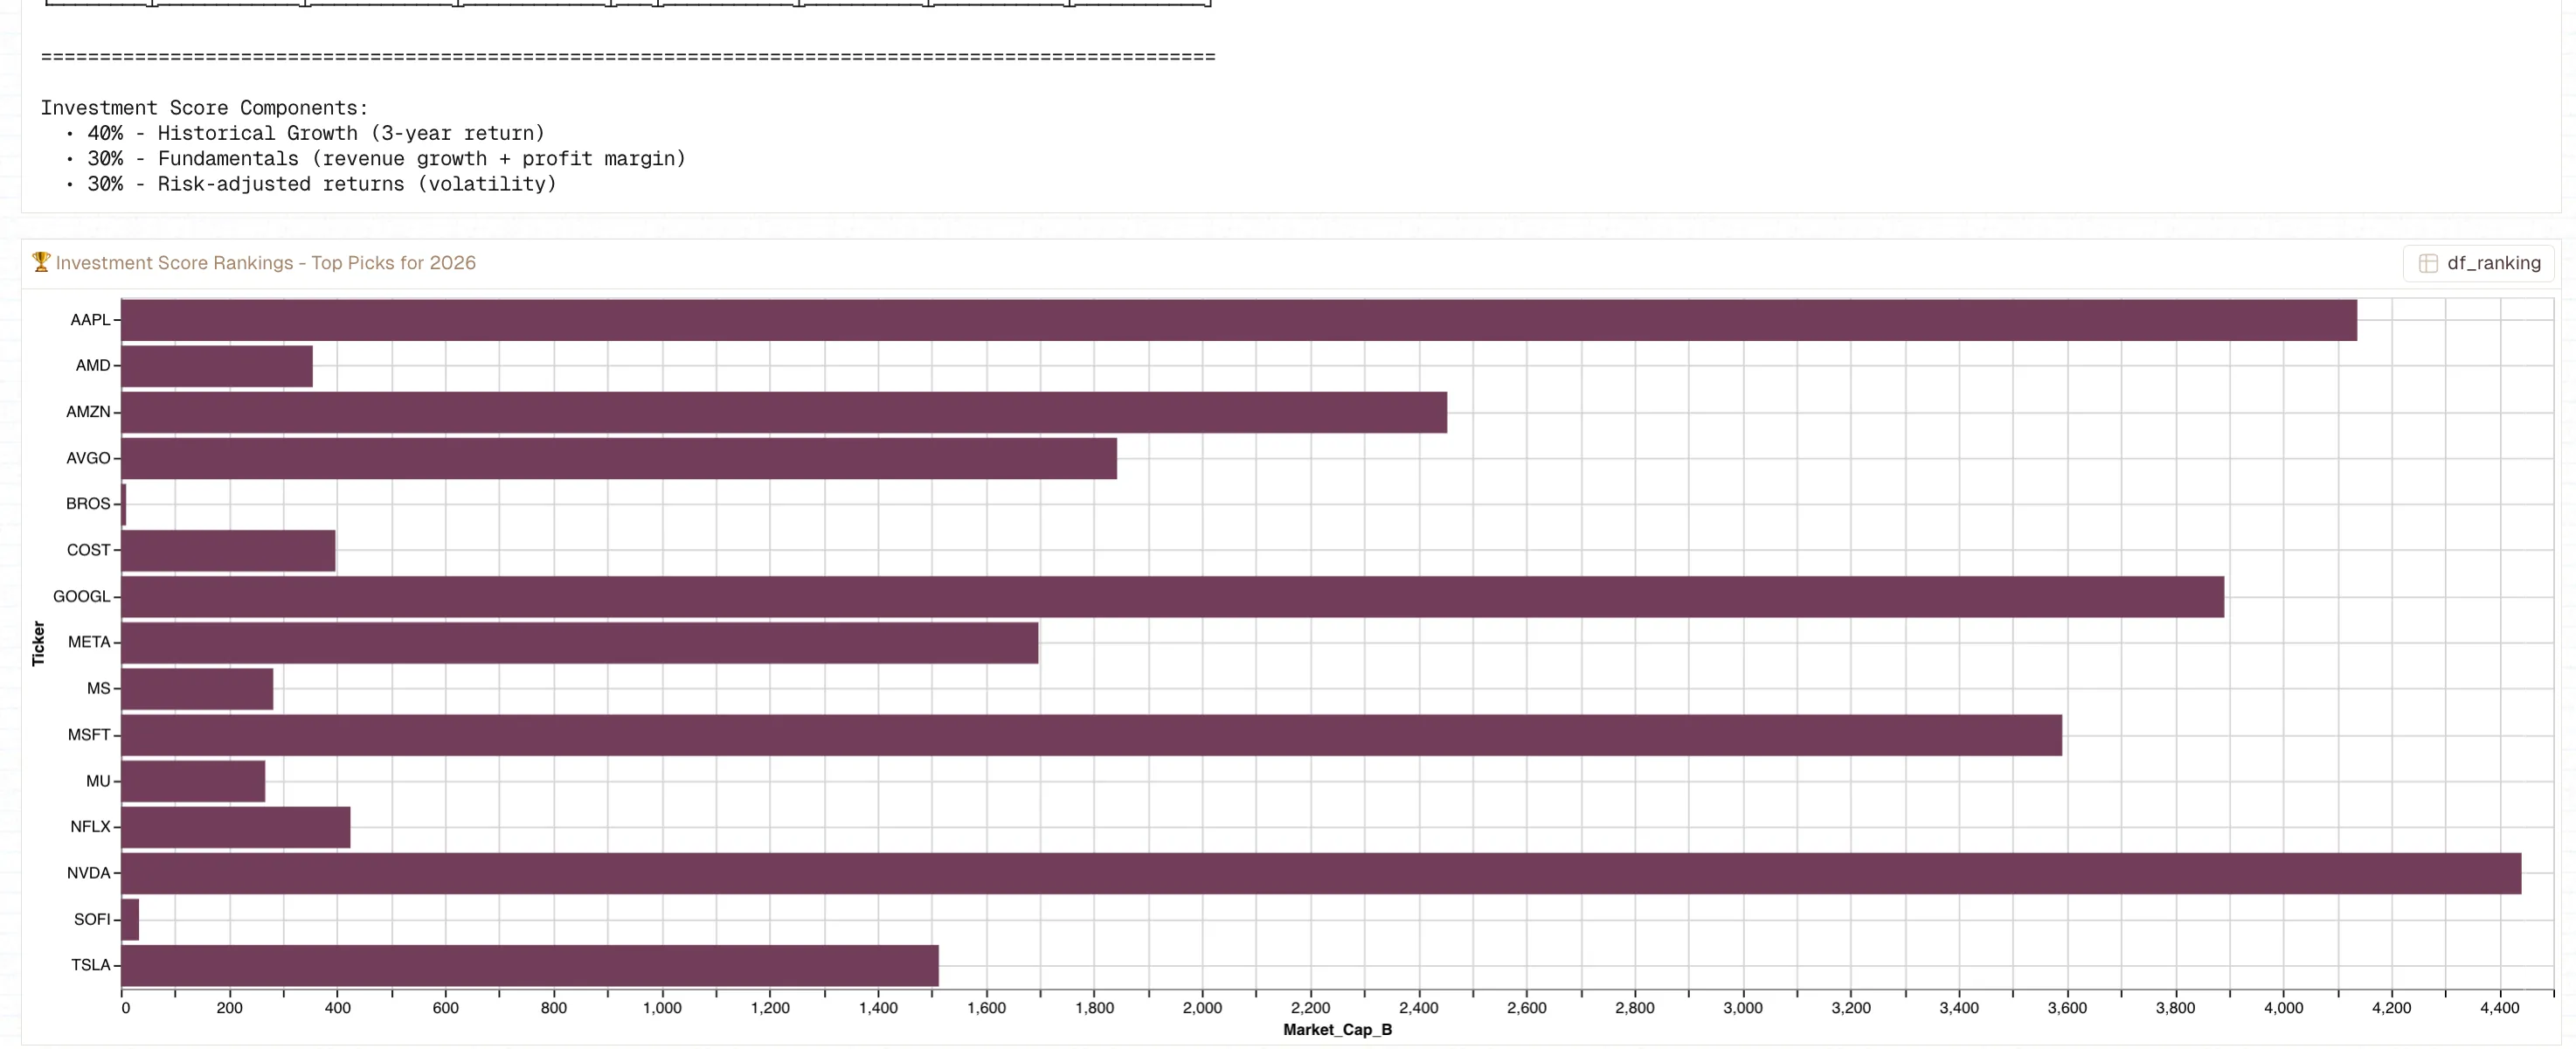
Here’s the kicker: our model still ranks it number one for 2026.
Current price sits at $182.41 with a market cap pushing $4.4 trillion. Revenue growth? A casual 62.5%. Profit margin? A staggering 53%. These aren’t just good numbers, they’re the kind of numbers that make CFOs weep with envy.
But, and there’s always a but, volatility is running at 50.7%. Translation: buckle up for a wild ride. If you can’t handle watching your portfolio swing 30% in a month, maybe sit this one out.
The Quiet Giant Making Noise
While everyone’s obsessing over NVIDIA, Broadcom has been quietly building an empire. The stock’s up 673.5% over three years, and it snagged the number two spot in our analysis with an investment score of 5.01.
Broadcom’s the diversification play in semiconductors. They’re in networking, storage, wireless, custom AI chips, basically everywhere NVIDIA isn’t dominant. Their VMware acquisition is expanding them into software, which gives them revenue streams that aren’t purely dependent on the next chip cycle.
The P/E ratio of 100.1 makes value investors nervous (hell, it makes me nervous), but when you’re growing at 16.4% with 31.6% profit margins, the market’s willing to pay a premium. Whether that premium is sustainable? That’s the $1.8 trillion question.
Social Media’s Second Act
Meta Platforms, yes, the company formerly known as Facebook, has staged one of tech’s most impressive comebacks. Remember when everyone thought Zuckerberg had lost his mind with the metaverse pivot? The stock got absolutely hammered in 2022.
Fast forward to today: 487.5% three-year return, investment score of 4.65, and that metaverse bet is looking less crazy by the quarter. Revenue’s growing at 26.2%, profit margins are a healthy 30.9%, and the volatility (38.6%) is actually lower than most tech stocks.
What changed? AI-driven advertising improvements, Reels competing effectively with TikTok, and Reality Labs burning slightly less cash. Plus, turns out having 3 billion users across your platforms is still a pretty solid moat.
The Fintech Wildcard
Here’s where things get interesting. SoFi Technologies grabbed the number four spot despite being a relative baby compared to the tech giants. Market cap of just $33.5 billion, but a three-year return of 531.4% and revenue growth of 37.8%.
SoFi’s the fintech disruptor play, digital banking, student loan refinancing, investment services. They’re basically trying to be the bank for millennials and Gen Z who’d rather eat glass than walk into a Chase branch.
The catch? Volatility of 62.2%. This stock can swing harder than a baseball bat at a piñata. The investment thesis is solid, traditional banking is ripe for disruption, but the execution risk is real. This is your speculative 5% allocation, not your retirement savings.
The Memory Game
Micron Technology rounds out the top five, and honestly, this one surprised me. Memory chips aren’t exactly sexy, until AI needs massive amounts of them.
Three-year return: 336.8%. Revenue growth: 46%. The AI boom needs memory bandwidth like Formula 1 cars need premium fuel. Micron’s positioned right in that pipeline, supplying the high-bandwidth memory (HBM) that makes AI training possible.
Volatility’s high at 50.6%, and memory chip markets are notoriously cyclical. But the AI infrastructure buildout isn’t slowing down, and someone’s got to supply the memory. Might as well be Micron.
What About the FAANG Stalwarts?
You might’ve noticed some familiar names lower on the list. Microsoft, Apple, Google, they’re all here, just not at the top. Why?
Simple: the scoring model weights historical growth (40%), fundamentals (30%), and risk-adjusted returns (30%). Microsoft’s “only” up 100% over three years. Apple’s at 98.4%. These are mature companies with lower volatility (23.4% and 26.1% respectively), which makes them safer plays but not the highest scorers.
Google (Alphabet) does better at number six with 245% three-year returns and the lowest volatility among major tech stocks at 30.4%. If you want tech exposure without the heart palpitations, Google’s your comfort food.
Tech Is Eating Everything
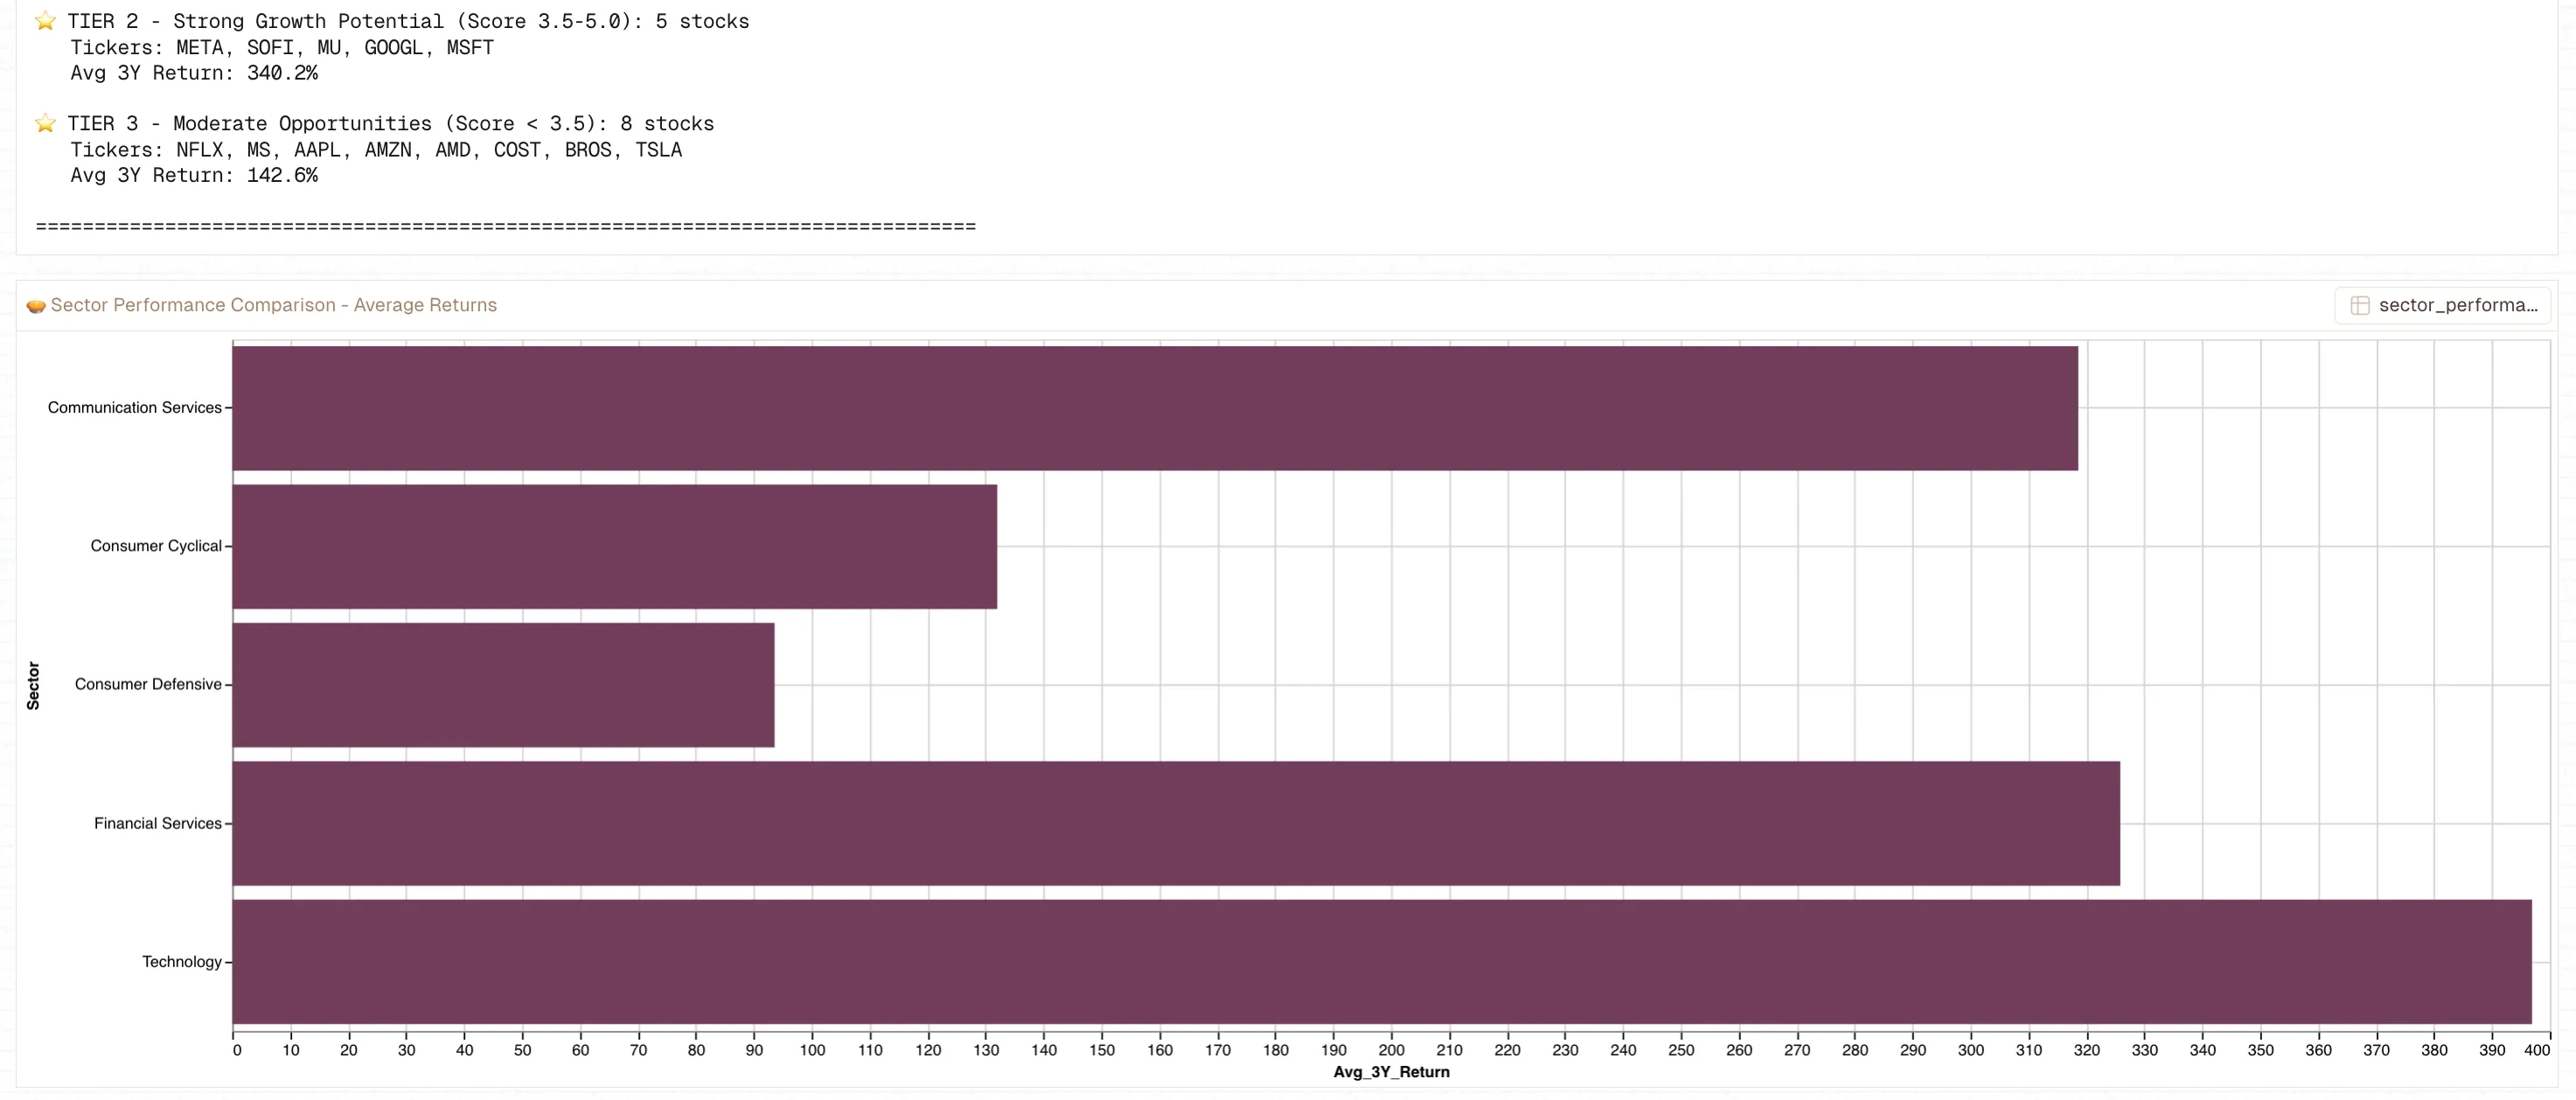
The sector breakdown tells you everything you need to know about where markets are heading. Technology stocks in our analysis averaged 397% three-year returns. Communication Services (which includes Meta and Netflix)? 319%.
Compare that to Consumer Defensive, represented by Costco at 94% returns, and the gap is staggering. Not that Costco’s doing badly; a near-double in three years with 20% volatility is actually impressive. It’s just that tech is playing a different game entirely.
Financial Services (Morgan Stanley and SoFi) averaged 326% returns, which sounds great until you remember SoFi’s 531% is pulling up Morgan Stanley’s more modest 120%. Still, the sector’s showing strength as fintech disruption continues.
How We Actually Use Livedocs for This Analysis
You know what? Let me pause the stock talk for a second and explain why doing this analysis in Livedocs was genuinely useful, not just marketing fluff.
Traditional investment research means juggling multiple tools. You’ve got your Python scripts in one window, SQL queries in another, Excel for the quick calcs, and maybe a Jupyter notebook somewhere that stopped working after your last OS update. Then you’re copying charts into PowerPoint, and by the time you’re done, the data’s already out of date.
Livedocs collapses all of that. Python and SQL live in the same interactive notebook. Want to pull historical stock data with yfinance? Done. Need to aggregate monthly performance with SQL-style operations using Polars? Right there. Building visualizations with matplotlib? Same notebook.
But here’s the kicker: it’s not just for solo analysis. The entire notebook becomes a shareable, interactive document. Your team can see the code, the data, the charts, and the narrative all in one place. When the market shifts and you need to update the analysis, you’re not rebuilding a presentation, you’re just re-running cells.
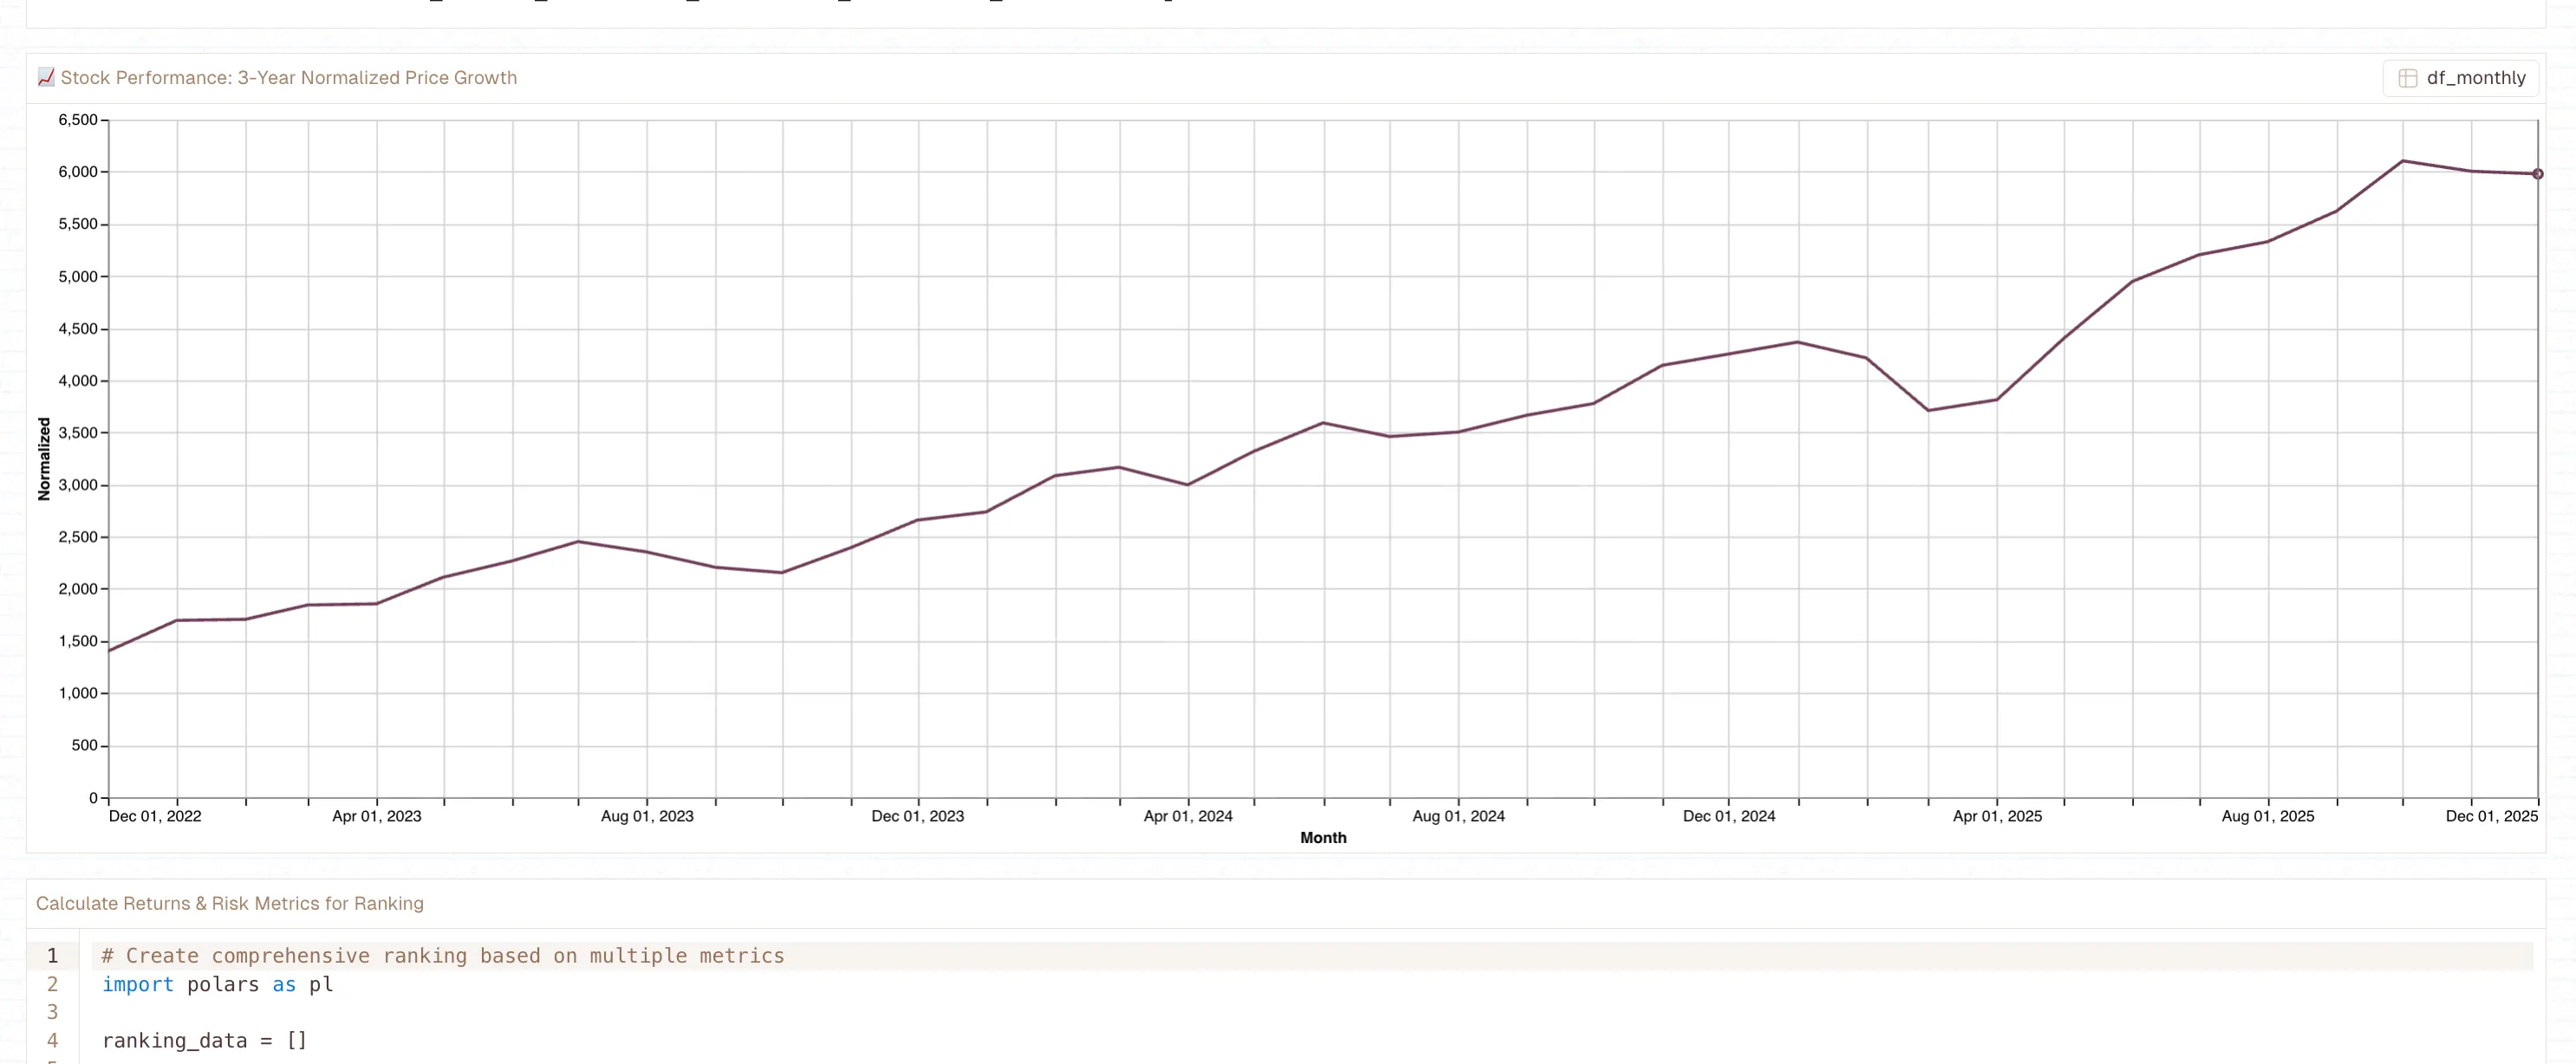
For this stock analysis specifically, we pulled three years of daily price data for 15 stocks (that’s ~11,265 data points), calculated normalized returns, aggregated to monthly performance, built a composite scoring system with weighted factors, and generated visualizations, all without leaving the platform. The whole workflow, from data ingestion to final insights, lives in one coherent space.
The Portfolio Construction Game Plan
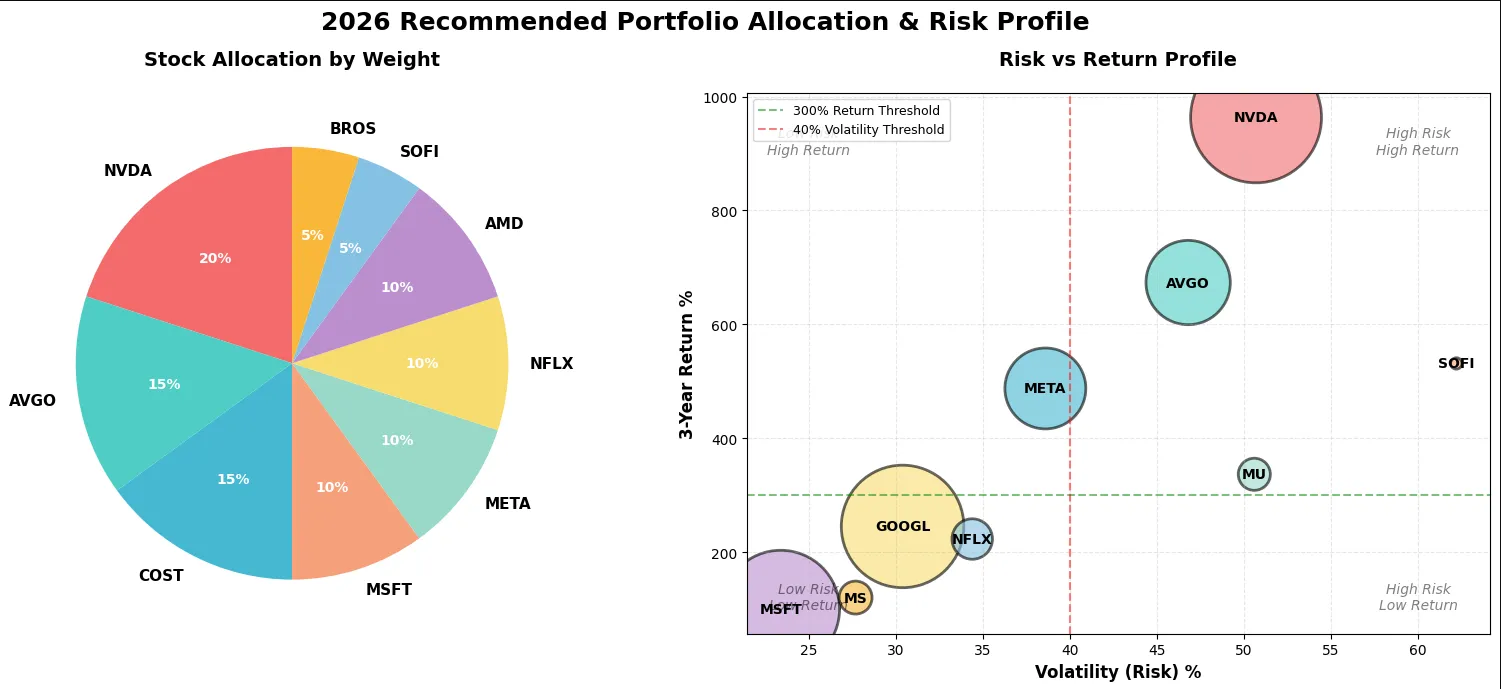
Right, back to the money. Here’s how the analysis suggests structuring a 2026 portfolio:
Core Holdings (60%): NVDA, AVGO, COST
These are your foundation, established leaders with proven track records. Yes, NVIDIA and Broadcom are volatile, but they’re also dominant in AI infrastructure. Costco’s your stabilizer.
Growth Opportunities (30%): META, NFLX, AMD
High-growth potential in expanding markets. Meta’s social media machine with metaverse optionality. Netflix is streaming plus gaming plus live sports. AMD is the NVIDIA alternative gaining market share.
Speculative/High-Risk (10%): SOFI, BROS (Dutch Bros)
Emerging companies with disruptive potential. This is your lottery ticket allocation. If SoFi becomes the challenger bank it aims to be, that 10% could make your year. If it doesn’t, you’ve limited the damage.
The Risk Reality Check
Here’s what nobody likes talking about: the volatility. The average volatility across these stocks is 40-50%. What does that mean in practice?
It means if you invest $100,000 in January, seeing it swing to $70,000 in March before recovering to $110,000 in May isn’t just possible, it’s probable. Can you handle that psychologically? Most people can’t, which is why they end up panic-selling at the bottom.
Dollar-cost averaging helps. So does only investing money you won’t need for 3-5 years. But fundamentally, if you’re building a portfolio around these stocks, you need an iron stomach.
The safer plays, Costco at 20% volatility, Microsoft at 23.4%, Apple at 26.1%, won’t make you rich quick. But they also won’t give you an ulcer.
What Could Go Wrong?
Let’s not kid ourselves, investment analyses are educated guesses dressed up in impressive charts. What could torpedo this strategy?
AI winter.
If the AI boom fizzles like blockchain did, NVIDIA, Broadcom, AMD, and half this portfolio crater. Hyperscalers are spending $500 billion on AI infrastructure based on the assumption that it’ll generate returns. If it doesn’t, that spending stops yesterday.
Recession.
Consumer discretionary spending tanks first. There goes Netflix subscriber growth, SoFi loan originations, and Tesla’s ability to move $80,000 electric cars.
Regulation.
Meta, Google, and Amazon are perpetually one antitrust ruling away from structural changes. European regulators are particularly aggressive, and the U.S. is getting more interested.
Valuation compression.
Many of these stocks trade at premium P/E ratios. If the market decides growth isn’t worth paying 45x earnings (looking at you, NVIDIA), valuations reset lower fast.
Black swans.
Geopolitical chaos, pandemic redux, climate disasters, the stuff you can’t predict but definitely impacts markets.
The Actual Numbers That Matter
Let me throw some statistics at you because that’s what data-driven analysis requires:
- Average three-year return across all 15 stocks: 298.6%
- Average one-year return: 40.8%
- Best three-year performer: NVDA at 963.5%
- Highest revenue growth: NVDA at 62.5%
- Most profitable (margin): NVDA at 53%
- Lowest volatility: COST at 20%
- Highest market cap: NVDA at $4.4 trillion
- Average investment score: 3.67/10
That last number might seem low, but remember: the scoring system is tough. A score above 5.0 is exceptional, 3.5-5.0 is strong growth potential, and below 3.5 is moderate opportunities. Only two stocks (NVIDIA and Broadcom) cracked the “exceptional” tier.
Expected Returns vs. Reality
The model projects three scenarios for portfolio performance:
- Conservative: 15-25% annual return
- Base Case: 30-45% annual return
- Optimistic: 50%+ annual return
Those are eye-popping numbers, especially considering the S&P 500’s historical average of ~10%. But they come with expected portfolio volatility of 35-40% and maximum drawdown risk of 25-35%.
In English: yes, you might make 40% in a year. You also might lose 30% first. Both can be true.
The Buy and Sell Signals
Timing isn’t everything, but it’s not nothing either. Buy signals to watch:
- Market pullbacks of 10%+ in quality names (your shopping opportunity)
- Strong earnings beats with raised guidance (momentum confirmation)
- New product launches or major partnerships (growth catalysts)
- Sector rotation into undervalued areas (contrarian opportunity)
Sell signals that should make you nervous:
- Revenue growth declining for 2+ consecutive quarters (trend break)
- Major competitive threats emerging (moat erosion)
- Valuation exceeds 100x forward earnings for growth stocks (bubble territory)
- Individual position exceeds 25% of portfolio (concentration risk)
My Honest Take
If I’m being completely transparent? The data says NVIDIA, Broadcom, and Meta are the plays. The AI infrastructure buildout is real, the spending is real, and the companies positioned to supply that infrastructure are printing money.
But I’d personally want more diversification. The concentration in semiconductors makes me itchy. If chip demand softens even slightly, three of your top five holdings get hit simultaneously.
I’d probably do 15% NVIDIA, 10% Broadcom, 10% Meta, 10% Google, 10% Microsoft, 10% Costco, 10% Netflix, and spread the remaining 25% across SoFi, AMD, Apple, Morgan Stanley, and maybe a position in a broad market index fund just to hedge against my own overconfidence.
That’s not what the model says to do. But the model doesn’t have to sleep at night wondering if it’s too concentrated in AI chip makers.
The 2026 Outlook
Look, anyone who tells you they know what 2026 holds is lying. We could be in the middle of an AI-driven productivity revolution that makes the internet boom look quaint. Or we could be approaching a valuation reset that makes 2022 feel like a warmup.
What the data shows is this: companies driving the AI infrastructure buildout (NVIDIA, Broadcom, Micron) have massive tailwinds. Social media platforms leveraging AI (Meta, Google) are improving their core businesses. Fintech disruptors (SoFi) are capturing younger demographics. Entertainment streaming (Netflix) is maturing into a stable cash generator.
If those trends continue, the stocks should perform. If they don’t, well, that’s why we need to diversify and stop-loss orders.
Final Thoughts
The beautiful thing about data-driven analysis is that it forces you to confront reality instead of narratives. The numbers don’t care about your feelings, your political views, or what Jim Cramer said on Mad Money.
NVIDIA’s 963% return isn’t hype, it actually happened. Whether it can happen again is a different question, but the historical performance is undeniable. Same with Broadcom’s 673% or Meta’s comeback story.
The scoring methodology we used isn’t perfect, but it’s transparent and replicable. You could adjust the weights (maybe you think recent performance matters more than historical returns), change the risk factors (perhaps volatility concerns you more), or add new metrics entirely (ESG scores, dividend yields, whatever).
That’s the point. This analysis is a framework, not dogma.
To make your own analysis like this? Use Livedocs.
- 8x speed response
- Ask agent to find datasets for you
- Set system rules for agent
- Collaborate
- And more
Get started with Livedocs and build your first live notebook in minutes.
- 💬 If you have questions or feedback, please email directly at a[at]livedocs[dot]com
- 📣 Take Livedocs for a spin over at livedocs.com/start. Livedocs has a great free plan, with $10 per month of LLM usage on every plan
- 🤝 Say hello to the team on X and LinkedIn
Stay tuned for the next article!
Methodology Note: Analysis conducted December 2025 using Yahoo Finance historical data (December 2022 - December 2025). Investment scoring system weights: 40% historical growth (3-year returns), 30% fundamentals (revenue growth + profit margins), 30% risk-adjusted returns (volatility). Analysis covers 15 selected stocks across 5 sectors and does not represent comprehensive market coverage.
Keep in mind this isn’t financial advice
Ready to analyze your data?
Upload your CSV, spreadsheet, or connect to a database. Get charts, metrics, and clear explanations in minutes.
No signup required — start analyzing instantly

