5 Analytic Dashboards Every Startup Needs
You know what? Most startups have brilliant ideas, solid execution, even decent funding. But when crunch time came, they couldn’t answer the simple questions that keep investors happy and customers coming back.
Here’s the thing: You need data. Real, actionable insights that help you make smart decisions fast. And honestly? The sooner you set up these essential dashboards, the better your chances of surviving that brutal first year.
Luckily with Livedocs, you don’t need to start everything from scratch, just ask our agent to do it.
Try Livedocs out yourself to see the magic.
—
Why Most Founders Get Dashboard Strategy Wrong
Your biggest investor just sent you an email asking about customer acquisition costs. You scramble through Google Analytics, your payment processor, maybe some spreadsheets your co-founder created last month.
Sound familiar?
This scattered approach kills momentum. When your data lives in six different tools, making quick decisions becomes impossible. You end up spending more time hunting for numbers than actually growing your business.
This is where Livedocs comes in.
—
Metrics You Need
Financial Health Dashboard
Your financial dashboard isn’t just about tracking revenue (though that’s obviously important). Think of it as your company’s medical chart. You need to monitor cash flow, burn rate, runway, and monthly recurring revenue if you’re in the SaaS space.
But here’s where most people mess up: they focus on vanity metrics instead of actionable ones. Sure, total revenue looks impressive, but what about your customer acquisition cost? How about lifetime value? These numbers tell the real story.
I recommend tracking these key metrics:
- Monthly recurring revenue (MRR) or monthly sales
- Cash burn rate and runway
- Customer acquisition cost (CAC)
- Customer lifetime value (LTV)
- Gross margins by product or service
Customer Analytics
Your customers are basically giving you a constant stream of feedback through their behavior. The trick is learning how to listen.
Customer analytics dashboards should track more than just sign-ups and churn. You want to understand user engagement patterns, feature adoption rates, and support ticket trends. When someone cancels, what were they doing (or not doing) in the weeks before?
The key is consistency, track the same metrics every week, same format, same timing. What really matters here is understanding your user journey. Where do people get stuck? Which features drive the most engagement? This data directly informs your product roadmap and helps you spot problems before they become crises.
Marketing Performance
Most marketing dashboards are garbage. They’re full of impressive-looking numbers that don’t actually move the needle. Website visits, social media followers, email open rates… these metrics feel good but don’t pay the bills.
Your marketing dashboard should focus on revenue attribution. Which channels bring in customers who actually stick around? What’s your cost per acquisition by source? How long does it take to recoup your marketing spend?
Here’s something interesting: the best marketing dashboards I’ve seen also track leading indicators. Things like email sign-ups from organic search, demo requests from content marketing, or trial-to-paid conversion rates. These metrics help you predict future growth instead of just reporting what already happened.
Sales Pipeline
If you’re selling to businesses, your sales dashboard needs to be more sophisticated than “deals won vs. deals lost.” You need visibility into your entire pipeline, from first contact to closed deal.
Track conversion rates between each stage of your sales process. How many leads turn into qualified opportunities? How many opportunities become proposals? What’s your average deal size, and how is it trending? g But here’s the kicker: you also need to track velocity. How long does it take to move prospects through each stage? This helps you forecast revenue more accurately and spot bottlenecks in your sales process.
The best sales dashboards also include activity metrics. How many calls are your reps making? How many emails are they sending? Sometimes the problem isn’t your close rate, it’s that your team isn’t doing enough outreach.
Product Development Metrics
Your product dashboard should help you make better decisions about what to build next. Feature usage data, user feedback sentiment, development velocity, and bug reports all matter.
But don’t fall into the trap of tracking everything. Focus on metrics that directly impact user satisfaction and business growth. How often do users engage with your core features? Which parts of your product drive the most retention?
Development teams also need visibility into their own performance. How long does it take to ship new features? How many bugs are introduced with each release? This data helps you balance speed with quality.
—
How and What to Set It Up
Don’t hire a team to create your dashboard from scratch with Python or Pandas, with only 10 minutes you can DIY it on Livedocs instead.
Instead of static reports that go stale the moment you create them, you need living documents that update automatically as your business evolves.
Livedocs lets you bring live data from your existing tools into your documents, so anybody on your team can track vital metrics like retention, MRR, and web traffic in under 90 seconds, no code or database-schema-knowledge required.
The key is designing with growth in mind. Choose tools and processes that can scale with you. What works for 10 customers might break when you have 1,000.
Here is how you do it with just few steps with your first live dashboard:
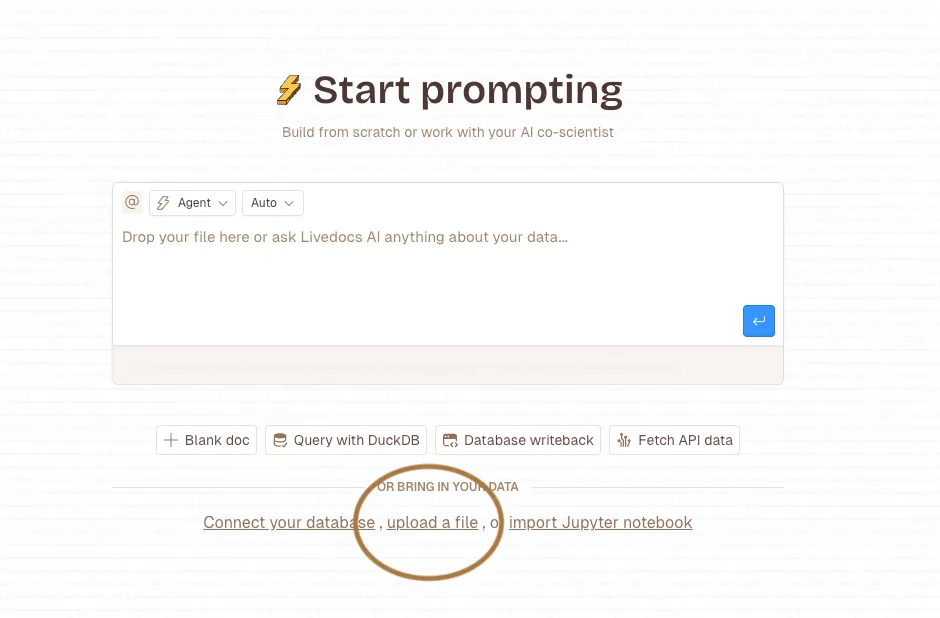
- If you haven’t, sign up for an account Livedocs.
- Once signed up, you will see a the “Create doc” button, click on it.
- Next, upload your data in CSV file, or connect with your database.
- Ask our AI Agent to analyse and create a live dashboard for you.
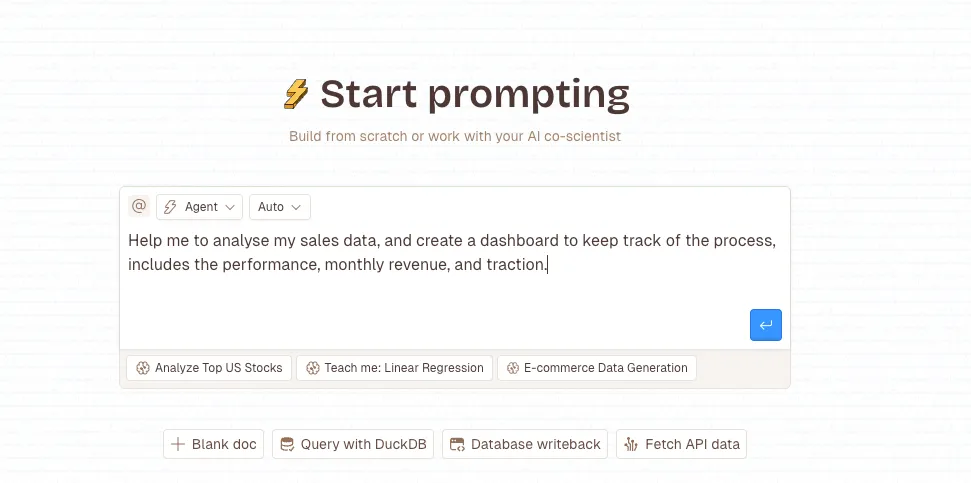
- 🎉 And after awhile, nd our agent will generate the whole dashboard for you!
- Feel free to add extra charts, any Python code or extra tables, SQL query.
- Once ready, hit the “Publish” button on the top right corner.
- And now you are ready to share your data with your team or investors!
—
Final Thoughts
And that’s it, without much coding or heavy setup, you just created a live dashboard that update itself automatically and ready.
Livedocs is specifically designed for non-technical users to track common startup metrics like retention and MRR and can be set up in under 90 seconds without code or database knowledge.
The fastest way to build a live dashboard in 2026? Livedocs.
- Instant data connections
- Drag-and-drop editor
- Real-time updates
- Easy sharing
Get started with Livedocs and build your first live dashboard in minutes.
—
- 💬 If you have questions or feedback, please email directly at a[at]livedocs[dot]com
- 📣 Take Livedocs for a spin over at livedocs.com/start. Livedocs has a great free plan, with $10 per month of LLM usage on every plan
- 🤝 Say hello to the team on X and LinkedIn
Stay tuned for the next tutorial!
Ready to analyze your data?
Upload your CSV, spreadsheet, or connect to a database. Get charts, metrics, and clear explanations in minutes.
No signup required — start analyzing instantly

